Short term Thinking in Investment Decisions of Businesses and Financial Markets

Short term Thinking in Investment Decisions of Businesses and Financial Markets


When companies buyback shares and pay dividends rather than investing in new capacity, it leads to low economic growth and low aggregate demand.

Central Banks respond by cutting interest rates.  Yet Businesses do not invest in new capacity.

Many studies attribute this to short term thinking dominant in corporate investment decisions.  Pressures from shareholders push corporate managers to be short term oriented.

Many economists and thinkers have criticized this recently as advanced economies are suffering from anemic growth.

Larry Summers has invoked Secular Stagnation.  He says one of the reason for Secular Stagnation is short term thinking.

Andy Haldane of Bank of England has criticized short term thinking as it prevents investments and causes low economic growth.

Key Terms:

  • Quarterly Capitalism
  • Secular Stagnation
  • Short Term Thinking
  • Low Economic Growth
  • Business Investments
  • Real Interest Rates
  • Monetary Policy
  • Income and Wealth Inequality
  • Aggregate Demand
  • Productive Capacity
  • Productivity growth
  • Long Term Investments
  • Share Buybacks
  • Dividends
  • Corporate Cash Pools


Capitalism for the Long Term

The near meltdown of the financial system and the ensuing Great Recession have been, and will remain, the defining issue for the current generation of executives. Now that the worst seems to be behind us, it’s tempting to feel deep relief—and a strong desire to return to the comfort of business as usual. But that is simply not an option. In the past three years we’ve already seen a dramatic acceleration in the shifting balance of power between the developed West and the emerging East, a rise in populist politics and social stresses in a number of countries, and significant strains on global governance systems. As the fallout from the crisis continues, we’re likely to see increased geopolitical rivalries, new international security challenges, and rising tensions from trade, migration, and resource competition. For business leaders, however, the most consequential outcome of the crisis is the challenge to capitalism itself.

That challenge did not just arise in the wake of the Great Recession. Recall that trust in business hit historically low levels more than a decade ago. But the crisis and the surge in public antagonism it unleashed have exacerbated the friction between business and society. On top of anxiety about persistent problems such as rising income inequality, we now confront understandable anger over high unemployment, spiraling budget deficits, and a host of other issues. Governments feel pressure to reach ever deeper inside businesses to exert control and prevent another system-shattering event.

My goal here is not to offer yet another assessment of the actions policymakers have taken or will take as they try to help restart global growth. The audience I want to engage is my fellow business leaders. After all, much of what went awry before and after the crisis stemmed from failures of governance, decision making, and leadership within companies. These are failures we can and should address ourselves.

In an ongoing effort that started 18 months ago, I’ve met with more than 400 business and government leaders across the globe. Those conversations have reinforced my strong sense that, despite a certain amount of frustration on each side, the two groups share the belief that capitalism has been and can continue to be the greatest engine of prosperity ever devised—and that we will need it to be at the top of its job-creating, wealth-generating game in the years to come. At the same time, there is growing concern that if the fundamental issues revealed in the crisis remain unaddressed and the system fails again, the social contract between the capitalist system and the citizenry may truly rupture, with unpredictable but severely damaging results.

Most important, the dialogue has clarified for me the nature of the deep reform that I believe business must lead—nothing less than a shift from what I call quarterly capitalism to what might be referred to as long-term capitalism. (For a rough definition of “long term,” think of the time required to invest in and build a profitable new business, which McKinsey research suggests is at least five to seven years.) This shift is not just about persistently thinking and acting with a next-generation view—although that’s a key part of it. It’s about rewiring the fundamental ways we govern, manage, and lead corporations. It’s also about changing how we view business’s value and its role in society.

There are three essential elements of the shift. First, business and finance must jettison their short-term orientation and revamp incentives and structures in order to focus their organizations on the long term. Second, executives must infuse their organizations with the perspective that serving the interests of all major stakeholders—employees, suppliers, customers, creditors, communities, the environment—is not at odds with the goal of maximizing corporate value; on the contrary, it’s essential to achieving that goal. Third, public companies must cure the ills stemming from dispersed and disengaged ownership by bolstering boards’ ability to govern like owners.

When making major decisions, Asians typically think in terms of at least 10 to 15 years. In the U.S. and Europe, nearsightedness is the norm.

None of these ideas, or the specific proposals that follow, are new. What is new is the urgency of the challenge. Business leaders today face a choice: We can reform capitalism, or we can let capitalism be reformed for us, through political measures and the pressures of an angry public. The good news is that the reforms will not only increase trust in the system; they will also strengthen the system itself. They will unleash the innovation needed to tackle the world’s grand challenges, pave the way for a new era of shared prosperity, and restore public faith in business.

1. Fight the Tyranny of Short-Termism

As a Canadian who for 25 years has counseled business, public sector, and nonprofit leaders across the globe (I’ve lived in Toronto, Sydney, Seoul, Shanghai, and now London), I’ve had a privileged glimpse into different societies’ values and how leaders in various cultures think. In my view, the most striking difference between East and West is the time frame leaders consider when making major decisions. Asians typically think in terms of at least 10 to 15 years. For example, in my discussions with the South Korean president Lee Myung-bak shortly after his election in 2008, he asked us to help come up with a 60-year view of his country’s future (though we settled for producing a study called National Vision 2020.) In the U.S. and Europe, nearsightedness is the norm. I believe that having a long-term perspective is the competitive advantage of many Asian economies and businesses today.

Myopia plagues Western institutions in every sector. In business, the mania over quarterly earnings consumes extraordinary amounts of senior time and attention. Average CEO tenure has dropped from 10 to six years since 1995, even as the complexity and scale of firms have grown. In politics, democracies lurch from election to election, with candidates proffering dubious short-term panaceas while letting long-term woes in areas such as economic competitiveness, health, and education fester. Even philanthropy often exhibits a fetish for the short term and the new, with grantees expected to become self-sustaining in just a few years.

Lost in the frenzy is the notion that long-term thinking is essential for long-term success. Consider Toyota, whose journey to world-class manufacturing excellence was years in the making. Throughout the 1950s and 1960s it endured low to nonexistent sales in the U.S.—and it even stopped exporting altogether for one bleak four-year period—before finally emerging in the following decades as a global leader. Think of Hyundai, which experienced quality problems in the late 1990s but made a comeback by reengineering its cars for long-term value—a strategy exemplified by its unprecedented introduction, in 1999, of a 10-year car warranty. That radical move, viewed by some observers as a formula for disaster, helped Hyundai quadruple U.S. sales in three years and paved the way for its surprising entry into the luxury market.

To be sure, long-term perspectives can be found in the West as well. For example, in 1985, in the face of fierce Japanese competition, Intel famously decided to abandon its core business, memory chips, and focus on the then-emerging business of microprocessors. This “wrenching” decision was “nearly inconceivable” at the time, says Andy Grove, who was then the company’s president. Yet by making it, Intel emerged in a few years on top of a new multi-billion-dollar industry. Apple represents another case in point. The iPod, released in 2001, sold just 400,000 units in its first year, during which Apple’s share price fell by roughly 25%. But the board took the long view. By late 2009 the company had sold 220 million iPods—and revolutionized the music business.

It’s fair to say, however, that such stories are countercultural. In the 1970s the average holding period for U.S. equities was about seven years; now it’s more like seven months. According to a recent paper by Andrew Haldane, of the Bank of England, such churning has made markets far more volatile and produced yawning gaps between corporations’ market price and their actual value. Then there are the “hyperspeed” traders (some of whom hold stocks for only a few seconds), who now account for 70% of all U.S. equities trading, by one estimate. In response to these trends, executives must do a better job of filtering input, and should give more weight to the views of investors with a longer-term, buy-and-hold orientation.

If they don’t, short-term capital will beget short-term management through a natural chain of incentives and influence. If CEOs miss their quarterly earnings targets, some big investors agitate for their removal. As a result, CEOs and their top teams work overtime to meet those targets. The unintended upshot is that they manage for only a small portion of their firm’s value. When McKinsey’s finance experts deconstruct the value expectations embedded in share prices, we typically find that 70% to 90% of a company’s value is related to cash flows expected three or more years out. If the vast majority of most firms’ value depends on results more than three years from now, but management is preoccupied with what’s reportable three months from now, then capitalism has a problem.

Roughly 70% of all U.S. equities trading is now done by “hyperspeed” traders—some of whom hold stocks for only a few seconds.

Some rightly resist playing this game. Unilever, Coca-Cola, and Ford, to name just a few, have stopped issuing earnings guidance altogether. Google never did. IBM has created five-year road maps to encourage investors to focus more on whether it will reach its long-term earnings targets than on whether it exceeds or misses this quarter’s target by a few pennies. “I can easily make my numbers by cutting SG&A or R&D, but then we wouldn’t get the innovations we need,” IBM’s CEO, Sam Palmisano, told us recently. Mark Wiseman, executive vice president at the Canada Pension Plan Investment Board, advocates investing “for the next quarter century,” not the next quarter. And Warren Buffett has quipped that his ideal holding period is “forever.” Still, these remain admirable exceptions.

To break free of the tyranny of short-termism, we must start with those who provide capital. Taken together, pension funds, insurance companies, mutual funds, and sovereign wealth funds hold $65 trillion, or roughly 35% of the world’s financial assets. If these players focus too much attention on the short term, capitalism as a whole will, too.

In theory they shouldn’t, because the beneficiaries of these funds have an obvious interest in long-term value creation. But although today’s standard practices arose from the desire to have a defensible, measurable approach to portfolio management, they have ended up encouraging shortsightedness. Fund trustees, often advised by investment consultants, assess their money managers’ performance relative to benchmark indices and offer only short-term contracts. Those managers’ compensation is linked to the amount of assets they manage, which typically rises when short-term performance is strong. Not surprisingly, then, money managers focus on such performance—and pass this emphasis along to the companies in which they invest. And so it goes, on down the line.

Only 45% of those surveyed in the U.S. and the UK expressed trust in business. This stands in stark contrast to developing countries: For example, the figure is 61% in China, 70% in India, and 81% in Brazil.

As the stewardship advocate Simon Wong points out, under the current system pension funds deem an asset manager who returns 10% to have underperformed if the relevant benchmark index rises by 12%. Would it be unthinkable for institutional investors instead to live with absolute gains on the (perfectly healthy) order of 10%—especially if they like the approach that delivered those gains—and review performance every three or five years, instead of dropping the 10-percenter? Might these big funds set targets for the number of holdings and rates of turnover, at least within the “fundamental investing” portion of their portfolios, and more aggressively monitor those targets? More radically, might they end the practice of holding thousands of stocks and achieve the benefits of diversification with fewer than a hundred—thereby increasing their capacity to effectively engage with the businesses they own and improve long-term performance? Finally, could institutional investors beef up their internal skills and staff to better execute such an agenda? These are the kinds of questions we need to address if we want to align capital’s interests more closely with capitalism’s.

2. Serve Stakeholders, Enrich Shareholders

The second imperative for renewing capitalism is disseminating the idea that serving stakeholders is essential to maximizing corporate value. Too often these aims are presented as being in tension: You’re either a champion of shareholder value or you’re a fan of the stakeholders. This is a false choice.

The inspiration for shareholder-value maximization, an idea that took hold in the 1970s and 1980s, was reasonable: Without some overarching financial goal with which to guide and gauge a firm’s performance, critics feared, managers could divert corporate resources to serve their own interests rather than the owners’. In fact, in the absence of concrete targets, management might become an exercise in politics and stakeholder engagement an excuse for inefficiency. Although this thinking was quickly caricatured in popular culture as the doctrine of “greed is good,” and was further tarnished by some companies’ destructive practices in its name, in truth there was never any inherent tension between creating value and serving the interests of employees, suppliers, customers, creditors, communities, and the environment. Indeed, thoughtful advocates of value maximization have always insisted that it is long-term value that has to be maximized.

Capitalism’s founding philosopher voiced an even bolder aspiration. “All the members of human society stand in need of each others assistance, and are likewise exposed to mutual injuries,” Adam Smith wrote in his 1759 work, The Theory of Moral Sentiments. “The wise and virtuous man,” he added, “is at all times willing that his own private interest should be sacrificed to the public interest,” should circumstances so demand.

Smith’s insight into the profound interdependence between business and society, and how that interdependence relates to long-term value creation, still reverberates. In 2008 and again in 2010, McKinsey surveyed nearly 2,000 executives and investors; more than 75% said that environmental, social, and governance (ESG) initiatives create corporate value in the long term. Companies that bring a real stakeholder perspective into corporate strategy can generate tangible value even sooner. (See the sidebar “Who’s Getting It Right?”)

Creating direct business value, however, is not the only or even the strongest argument for taking a societal perspective. Capitalism depends on public trust for its legitimacy and its very survival. According to the Edelman public relations agency’s just-released 2011 Trust Barometer, trust in business in the U.S. and the UK (although up from mid-crisis record lows) is only in the vicinity of 45%. This stands in stark contrast to developing countries: For example, the figure is 61% in China, 70% in India, and 81% in Brazil. The picture is equally bleak for individual corporations in the Anglo-American world, “which saw their trust rankings drop again last year to near-crisis lows,” says Richard Edelman.

How can business leaders restore the public’s trust? Many Western executives find that nothing in their careers has prepared them for this new challenge. Lee Scott, Walmart’s former CEO, has been refreshingly candid about arriving in the top job with a serious blind spot. He was plenty busy minding the store, he says, and had little feel for the need to engage as a statesman with groups that expected something more from the world’s largest company. Fortunately, Scott was a fast learner, and Walmart has become a leader in environmental and health care issues.

Tomorrow’s CEOs will have to be, in Joseph Nye’s apt phrase, “tri-sector athletes”: able and experienced in business, government, and the social sector. But the pervading mind-set gets in the way of building those leadership and management muscles. “Analysts and investors are focused on the short term,” one executive told me recently. “They believe social initiatives don’t create value in the near term.” In other words, although a large majority of executives believe that social initiatives create value in the long term, they don’t act on this belief, out of fear that financial markets might frown. Getting capital more aligned with capitalism should help businesses enrich shareholders by better serving stakeholders.

3. Act Like You Own the Place

As the financial sector’s troubles vividly exposed, when ownership is broadly fragmented, no one acts like he’s in charge. Boards, as they currently operate, don’t begin to serve as a sufficient proxy. All the Devils Are Here, by Bethany McLean and Joe Nocera, describes how little awareness Merrill Lynch’s board had of the firm’s soaring exposure to subprime mortgage instruments until it was too late. “I actually don’t think risk management failed,” Larry Fink, the CEO of the investment firm BlackRock, said during a 2009 debate about the future of capitalism, sponsored by the Financial Times. “I think corporate governance failed, because…the boards didn’t ask the right questions.”

What McKinsey has learned from studying successful family-owned companies suggests a way forward: The most effective ownership structure tends to combine some exposure in the public markets (for the discipline and capital access that exposure helps provide) with a significant, committed, long-term owner. Most large public companies, however, have extremely dispersed ownership, and boards rarely perform the single-owner-proxy role. As a result, CEOs too often listen to the investors (and members of the media) who make the most noise. Unfortunately, those parties tend to be the most nearsighted ones. And so the tyranny of the short term is reinforced.

The answer is to renew corporate governance by rooting it in committed owners and by giving those owners effective mechanisms with which to influence management. We call this ownership-based governance, and it requires three things:

Just 43% of the nonexecutive directors of public companies believe they significantly influence strategy. For this to change, board members must devote much more time to their roles.

More-effective boards.

In the absence of a dominant shareholder (and many times when there is one), the board must represent a firm’s owners and serve as the agent of long-term value creation. Even among family firms, the executives of the top-performing companies wield their influence through the board. But only 43% of the nonexecutive directors of public companies believe they significantly influence strategy. For this to change, board members must devote much more time to their roles. A government-commissioned review of the governance of British banks last year recommended an enormous increase in the time required of nonexecutive directors of banks—from the current average, between 12 and 20 days annually, to between 30 and 36 days annually. What’s especially needed is an increase in the informal time board members spend with investors and executives. The nonexecutive board directors of companies owned by private equity firms spend 54 days a year, on average, attending to the company’s business, and 70% of that time consists of informal meetings and conversations. Four to five days a month obviously give a board member much greater understanding and impact than the three days a quarter (of which two may be spent in transit) devoted by the typical board member of a public company.

Boards also need much more relevant experience. Industry knowledge—which four of five nonexecutive directors of big companies lack—helps boards identify immediate opportunities and reduce risk. Contextual knowledge about the development path of an industry—for example, whether the industry is facing consolidation, disruption from new technologies, or increased regulation—is highly valuable, too. Such insight is often obtained from experience with other industries that have undergone a similar evolution.

In addition, boards need more-effective committee structures—obtainable through, for example, the establishment of a strategy committee or of dedicated committees for large business units. Directors also need the resources to allow them to form independent views on strategy, risk, and performance (perhaps by having a small analytical staff that reports only to them). This agenda implies a certain professionalization of nonexecutive directorships and a more meaningful strategic partnership between boards and top management. It may not please some executive teams accustomed to boards they can easily “manage.” But given the failures of governance to date, it is a necessary change.

More-sensible CEO pay.

An important task of governance is setting executive compensation. Although 70% of board directors say that pay should be tied more closely to performance, CEO pay is too often structured to reward a leader simply for having made it to the top, not for what he or she does once there. Meanwhile, polls show that the disconnect between pay and performance is contributing to the decline in public esteem for business.

Companies should create real risk for executives.Some experts privately suggest mandating that new executives invest a year’s salary in the company.

CEOs and other executives should be paid to act like owners. Once upon a time we thought that stock options would achieve this result, but stock-option- based compensation schemes have largely incentivized the wrong behavior. When short-dated, options lead to a focus on meeting quarterly earnings estimates; even when long-dated (those that vest after three years or more), they can reward managers for simply surfing industry- or economy-wide trends (although reviewing performance against an appropriate peer index can help minimize free rides). Moreover, few compensation schemes carry consequences for failure—something that became clear during the financial crisis, when many of the leaders of failed institutions retired as wealthy people.

There will never be a one-size-fits-all solution to this complex issue, but companies should push for change in three key areas:

• They should link compensation to the fundamental drivers of long-term value, such as innovation and efficiency, not just to share price.

• They should extend the time frame for executive evaluations—for example, using rolling three-year performance evaluations, or requiring five-year plans and tracking performance relative to plan. This would, of course, require an effective board that is engaged in strategy formation.

• They should create real downside risk for executives, perhaps by requiring them to put some skin in the game. Some experts we’ve surveyed have privately suggested mandating that new executives invest a year’s salary in the company.

Redefined shareholder “democracy.”

The huge increase in equity churn in recent decades has spawned an anomaly of governance: At any annual meeting, a large number of those voting may soon no longer be shareholders. The advent of high-frequency trading will only worsen this trend. High churn rates, short holding periods, and vote-buying practices may mean the demise of the “one share, one vote” principle of governance, at least in some circumstances. Indeed, many large, top-performing companies, such as Google, have never adhered to it. Maybe it’s time for new rules that would give greater weight to long-term owners, like the rule in some French companies that gives two votes to shares held longer than a year. Or maybe it would make sense to assign voting rights based on the average turnover of an investor’s portfolio. If we want capitalism to focus on the long term, updating our notions of shareholder democracy in such ways will soon seem less like heresy and more like common sense.

While I remain convinced that capitalism is the economic system best suited to advancing the human condition, I’m equally persuaded that it must be renewed, both to deal with the stresses and volatility ahead and to restore business’s standing as a force for good, worthy of the public’s trust. The deficiencies of the quarterly capitalism of the past few decades were not deficiencies in capitalism itself—just in that particular variant. By rebuilding capitalism for the long term, we can make it stronger, more resilient, more equitable, and better able to deliver the sustainable growth the world needs. The three imperatives outlined above can be a start along this path and, I hope, a way to launch the conversation; others will have their own ideas to add.

The kind of deep-seated, systemic changes I’m calling for can be achieved only if boards, business executives, and investors around the world take responsibility for bettering the system they lead. Such changes will not be easy; they are bound to encounter resistance, and business leaders today have more than enough to do just to keep their companies running well. We must make the effort regardless. If capitalism emerges from the crisis vibrant and renewed, future generations will thank us. But if we merely paper over the cracks and return to our precrisis views, we will not want to read what the historians of the future will write. The time to reflect—and to act—is now.


Please see my other related posts.

Business Investments and Low Interest Rates

Mergers and Acquisitions – Long Term Trends and Waves


Key sources of Research:

Secular stagnation and low investment: Breaking the vicious cycle—a discussion paper

McKinsey

http://www.mckinsey.com/global-themes/europe/secular-stagnation-and-low-investment-breaking-the-vicious-cycle

Case Still Out on Whether Corporate Short-Termism Is a Problem

Larry Summers

http://larrysummers.com/2017/02/09/case-still-out-on-whether-corporate-short-termism-is-a-problem/

Where companies with a long-term view outperform their peers

McKinsey

http://www.mckinsey.com/global-themes/long-term-capitalism/where-companies-with-a-long-term-view-outperform-their-peers

How short-term thinking hampers long-term economic growth

FT

https://www.ft.com/content/8c868a98-b821-11e4-b6a5-00144feab7de

Anthony Hilton: Short-term thinking hits nations as a whole, not just big business

http://www.standard.co.uk/comment/comment/anthony-hilton-short-term-thinking-hits-nations-as-a-whole-not-just-big-business-10427294.html

Short-termism in business: causes, mechanisms and consequences

EY Poland Report

Click to access Short-termism_raport_EY.pdf

Overcoming the Barriers to Long-term Thinking in Financial Markets

Ruth Curran and Alice Chapple
Forum for the Future

Click to access long-term-thinking-fpf-report-july-11.pdf

Understanding Short-Termism: Questions and Consequences

Click to access Understanding-Short-Termism.pdf

Ending Short-Termism : An Investment Agenda for Growth

Click to access Ending-Short-Termism.pdf

The Short Long

Speech by
Andrew G Haldane, Executive Director, Financial Stability, and Richard Davies

Brussels May 2011

Click to access speech495.pdf

Capitalism for the Long Term

Dominic Barton

From the March 2011 Issue

https://hbr.org/2011/03/capitalism-for-the-long-term

Quarterly capitalism: The pervasive effects of short-termism and austerity

https://currentlyunderdevelopment.wordpress.com/2016/05/10/quarterly-capitalism-the-pervasive-effects-of-short-termism-and-austerity/

Is Short-Term Behavior Jeopardizing the Future Prosperity of Business?

Click to access IsShortTermBehaviorJeopardizingTheFutureProsperityOfBusiness_CEOStrategicimplications.pdf

Andrew G Haldane: The short long

Speech by Mr Andrew Haldane, Executive Director, Financial Stability, and Mr Richard
Davies, Economist, Financial Institutions Division, Bank of England,
at the 29th Société
Universitaire Européene de Recherches Financières Colloquium,
Brussels, 11 May 2011

Click to access r110511e.pdf

THE UNEASY CASE FOR FAVORING LONG-TERM SHAREHOLDERS

Jesse M. Fried

https://dash.harvard.edu/bitstream/handle/1/17985223/Fried_795.pdf?sequence=1

The fringe economic theory that might get traction in the 2016 campaign

https://www.washingtonpost.com/news/wonk/wp/2015/03/02/the-fringe-economic-theory-that-might-get-traction-in-the-2016-campaign/?utm_term=.932bc0b97758

FCLT Global:  Focusing Capital on the Long Term

Publications

http://www.fcltglobal.org/insights/publications

Finally, Evidence That Managing for the Long Term Pays Off

Dominic Barton

James Manyika

Sarah Keohane Williamson

February 07, 2017 UPDATED February 09, 2017

https://hbr.org/2017/02/finally-proof-that-managing-for-the-long-term-pays-off

Focusing Capital on the Long Term

Dominic Barton

Mark Wiseman

From the January–February 2014 Issue

Is Corporate Short-Termism Really a Problem? The Jury’s Still Out

Lawrence H. Summers

February 16, 2017

Yes, Short-Termism Really Is a Problem

Roger L. Martin

October 09, 2015

Long-Termism or Lemons

The Role of Public Policy in Promoting Long-Term Investments

By Marc Jarsulic, Brendan V. Duke, and Michael Madowitz October 2015

Center for American Progress

Click to access LongTermism-reportB.pdf


Overcoming Short-termism: A Call for A More Responsible Approach to Investment and Business Management

https://corpgov.law.harvard.edu/2009/09/11/overcoming-short-termism-a-call-for-a-more-responsible-approach-to-investment-and-business-management/


Focusing capital on the Long Term

Jean-Hugues Monier – Senior Parter – McKinsey & Company

Princeton University – November 2016

Click to access jean-hugues_j._monier_slides_final.pdf

Bank of Finland’s Payment And Settlement System Simulator (BoF-PSS2)

Bank of Finland’s Payment And Settlement System Simulator (BoF-PSS2)


From Payment and Settlement System Simulator

BOF-PSS2

The Bank of Finland provides a simulator called BoF-PSS2 for replicating payment and securities settlement systems. The simulator is adaptable for modelling multisystem setups that can be a combination of payment, securities settlement systems and CCP’s. The simulator is known to be unique and the first of its kind. Since its launch in 2002 it has been distributed to more than 90 countries and has contributed to numerous studies and research papers.

The simulator can be used to fulfill some of the regulatory requirements stated in the PFMI’s and BCBS requirements such as identifying the liquidity risks inpayment systems. Here under are topics the simulator can be used for:

  • Settlement, liquidity and credit risks in FMI’s
  • Systemic Risks and Counterparty risks in FMI’s
  • Identification of critical counterparts
  • Policy change impact evaluation
  • Network analysis
  • Liquidity dependency analysis
  • Relationship analysis of Monetary policy and liquidity needs for settlement of payments
  • Evaluation of sufficiency of liquidity buffers and margins
  • System merger effects on liquidity needs
  • System performance benchmarking
  • Netting algorithm testing and development
  • System development and prototyping

In comparison to static calculations of indicators, the simulation results naturally incorporate network (or systemic) effects rising from the payments flows and the technical properties of the infrastructures themselves. The results obtained from simulations are directly interpretable and have a self-evident meaning which is not always the case with all indicators. The results can directly be used for risk management purposes for example when evaluating the sufficiency of liquidity buffers and margins. Computer simulations take advantage of using the available information in full without losing micro-level information due to indicator aggregations.

The simulator is freely available for research purposes, and has already been introduced in numerous countries. It is possible to tailor and adapt the simulator to specific payment systems. Several adaptations of the simulator have already been made, eg. for TARGET2. The simulator team provides trainings, consultation and tailored adaptations which are priced for cost recovery. The training course aims at providing necessary skills for efficient use of BoF-PSS2 with hands on computer class exercises. It also presents numerous examples from real studies where the tool has been used. For more details see the training course outline. Minimum attendance to the session is four participants.

Basically, trainings are organised upon demand and it is also possible to order a training course to be held onsite outside the proposed dates.


From Payment and Settlement System Simulator / Product Page

product_en_144ppi

From Payment and Settlement System Simulator / Documentation page

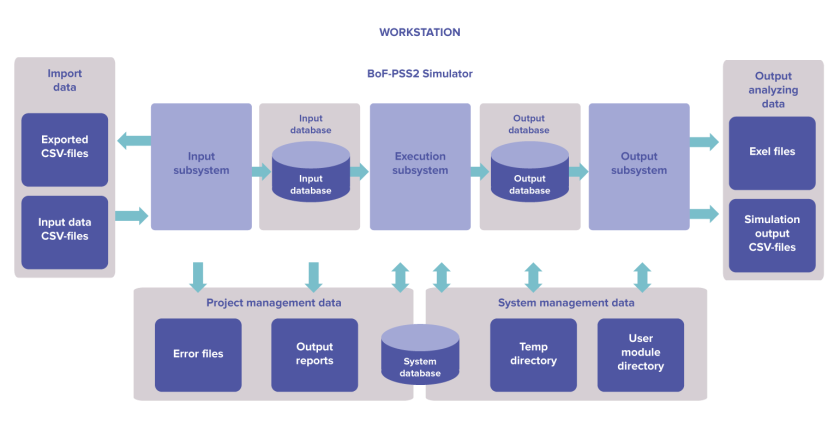
The Bank of Finland Payment and Settlement System Simulator, version 2 (BoF-PSS2), is a powerful tool for payment and securities settlement system simulations. The simulator supports multiple system structures and various settlement models.

The simulator is designed for analysing liquidity needs and risks in payment and settlement systems. Special situations, often difficult or impossible to test in a real environment, can be readily simulated with BoF-PSS2. Thus, users can study how behavioral patterns and changes in policy and conventions impact the payment and settlement systems and participants. The efficiency of gridlock-resolution and liquidity-saving measures can be analyzed as well.

The application is divided into three sub-systems:

  • Input sub-system for preparing and defining the input data,
  • Execution sub-system for running simulations,
  • Output sub-system for basic analyses of simulation results.

Different settlement logics are implemented into separate algorithms. To replicate specific systems, appropriate algorithms must be selected with appropriate parameters. Different algorithm combinations can be used to replicate a large number of current and potential settlement conventions and structures. Real-time gross settlement systems (RTGS), continuous net settlement systems (CNS), deferred net settlement systems (DNS) and hybrid systems can be implemented with the simulator as well as securities settlement and multicurrency systems. Inter-system connections and bridges make it possible to define multi- system environments consisting of various types of interdependent systems. E.g. it is possible to replicate the interaction of RTGS and securities settlement systems.

Advanced users of BoF-PSS2 can define and build their own user modules/algorithms and expand the basic features of the simulator to analyse new types of settlement processes. It is also possible to implement agent based modeling by adding algorithms replicating the participants’ behavior and decision making to control and alter the flow of submitted transactions. As a later addition, the simulator also has a network analysis module for generating networks and network indicators from either input data or results of simulations.

BoF-PSS2 has an easy to use graphical user interface. It is also possible to automate the use of the simulator via its command line interface (CLI).


From Payment and Settlement System Simulator / Product Page

TARGET2 SIMULATOR

A separate TARGET2 simulator version of BoF-PSS2 has been developed and delivered for the European System of Central Banks. It is based on the same basic software architechture and features of BoF-PSS2. Additional features are implemented as separate algorithm modules which replicate the proprietary algorithms of actual TARGET2 system. It is used by Eurosystem for quantitative analyses and numerical simulations of TARGET2.

TARGET2 simulator has been jointly delivered by Suomen Pankki (Bank of Finland) and the 3CB (Banca d’Italia, Deutsche Bundesbank, Banque de France) based on a decision of ECB Governing Council.


Key Terms

  • Liquidity Simulator
  • Payment System
  • Risk Management
  • Financial Stability
  • Cascades of Failures
  • Congestions and Delays
  • Financial Market Infrastructures
  • Payment Networks
  • Contagion
  • RTGS
  • Simulation Analysis
  • TARGET2
  • Intraday Payments


Key People

  • Harry Leinonen
  • Tatu Laine
  • Matti Hellqvist
  • Kimmo Soramäki


Key Sources of Research:


Payment and Settlement System Simulator – A tool for analysis of liquidity, risk and efficiency

Bank of Finland Payment and Settlement Simulator

2006


Click to access 2006_11a_hl.pdf


BoF-PSS2 Technical structure and simulation features

Harry Leinonen

Click to access 20031519seminarpresentationleinonen2.pdf


Payment and Settlement System Simulator

https://www.suomenpankki.fi/en/financial-stability/bof-pss2-simulator/

https://www.suomenpankki.fi/en/financial-stability/bof-pss2-simulator/product/

https://www.suomenpankki.fi/en/financial-stability/bof-pss2-simulator/events/


Publications

https://www.suomenpankki.fi/en/financial-stability/bof-pss2-simulator/publications/


Quantitative analysis of financial market infrastructures: further perspectives on financial stability

E50

https://helda.helsinki.fi/bof/handle/123456789/13990


Diagnostics for the financial markets : computational studies of payment system : Simulator Seminar Proceedings 2009-2011

E45

https://helda.helsinki.fi/bof/handle/123456789/9381


Simulation analyses and stress testing of payment networks

E42

https://helda.helsinki.fi/bof/handle/123456789/9369


Simulation studies of liquidity needs, risks and efficiency in payment networks : Proceedings from the Bank of Finland Payment and Settlement System Seminars 2005-2006

E39

https://helda.helsinki.fi/bof/handle/123456789/9370


Liquidity, risks and speed in payment and settlement systems : a simulation approach

E31

https://helda.helsinki.fi/bof/handle/123456789/9355


Simulation Analysis and Tools for the Oversight of Payment Systems


Click to access 2012-12-vigilanciasistemasdepago-10.pdf


Utilizing the BoF simulator in quantitative FMI analysis

Tatu Laine

Banco de México

15.10.2014


Click to access %7B15D9D1D3-D455-1E98-6FA6-AFB3B30C4ACB%7D.pdf


TARGET2 Simulator

Click to access target_newsletter_7_2013.pdf


Intraday patterns and timing of TARGET2 interbank payments

Marco Massarenti

Silvio Petriconi

Johannes Lindner


Click to access 0b5a0eb557b478843891449221c6ed2e7502.pdf


Communities and driver nodes in the TARGET2 payment system

Marco Galbiatiy, Lucian Stanciu-Vizeteuz

June 17, 2015


Click to access 5593d39c08ae1e9cb42a1904.pdf


Payment Delays and Contagion

Ben Craig† Dilyara Salakhova‡ Martin Saldias§

November 14, 2014

Click to access CraigSalakhovaSaldias_2014_preview.pdf


Federal Reserve Bank of New York Economic Policy Review

September 2008 Volume 14 Number 2

Special Issue: The Economics of Payments


Click to access EPRvol14n2.pdf


Contagion in Payment and Settlement Systems


Matti Hellqvist

2006


Click to access mh.pdf


Applications of BoF-PSS2 simulator and how to use it in agent based models


Click to access Hellqvist(presentation)_ABM-BaF09.pdf


Simulation and Analysis of Cascading Failure in Critical Infrastructure

Robert Glass, Walt Beyeler, Kimmo Soramäki, MortenBech and Jeffrey Arnold

Sandia National Laboratories, European Central Bank,  Federal Reserve Bank of New York

Click to access 07-glass_pres.pdf


Simulation analysis of payment systems


Kimmo Soramäki

2011

Click to access 2011-11-vigilancia-07.pdf


Simulating interbank payment and securities settlement mechanisms with the BoF-PSS2 simulator

Harry Leinonen

Kimmo Soramäki


2003


Click to access bof_dp_2303.pdf


Currency Credit Networks of International Banks

Currency Credit Networks of International Banks

During the Global Financial Crisis, institutions which were monitoring and regulating Banking systems realized that there are gaps in data to get a better understanding of cross border lending by Banks.

Bank of International Settlement BIS collects and publishes following datasets:

  • Consolidated Banking Statistics (CBS)
  • Locational Banking Statistics (LBS)


From US Banks’ International Balance Sheet Linkages: A Data Survey

International financial linkages are mostly established through banks’ lending and borrowing across the borders. Still, very little is known on the actual geographical composition of banks’ foreign balance sheet positions due to the fact that existing bilateral banking statistics is rather incomplete and scant both at the aggregate and micro level ( (Cerutti, et al., 2011); (Fender & Patrick, 2009); (McGuire & von Peter, 2009)). At the micro level, in particular, bilateral positions of banks by location of counterparty are neither collected by the regulator nor available from commercial databases (Herrero & Martinez Peira, 2007).

At the macro level, the Consolidated Banking Statistics (CBS) published by the Bank of International Settlements (BIS) is the most complete data source publicly available on aggregate bilateral claims of banks, available on a comparable cross-country basis and collected according to the nationality principle1. The CBS is best suited to assess country risk, as it reports gross claims of home and worldwide offices reported by national banks to individual foreign countries.

The consolidation within the CBS, however, does not allow to quantify gross cross-border bilateral positions that banks have vis-à-vis their foreign affiliates. Important direct linkages can, indeed, arise through cross-border positions with banks’ foreign-related entities, such as branches or subsidiaries, especially in those countries, such as the US, where foreign-related offices are the largest foreign counterparties of domestic banks.

Moreover, bilateral banking liabilities are not publicly available within the CBS preventing the assessment of other important macro risks arising from international banking activity, most notably funding and global systemic risks. The Committee on the Global Financial System (CGFS) at the the Bank of International Settlements (BIS) has recently announced that the latter limitation is being tackled in the new reporting regime in which banks must disclose also bilateral liabilities a consolidated basis with details of the instrument type (CGFS, 2012). The BIS also collects unconsolidated positions (i.e. both assets and liabilities) of banks located in a given country on all foreigners in the Locational Banking Statistics (LBS), in which bilateral positions are not publicly disclosed2. For the US, however, bilateral foreign unconsolidated banking assets and liabilities are available from the Treasury International Capital System (TICS)3. Coherent to the balance of payment residency principle, the reporting institutions are branches of foreign banks residing in the US which report their positions vis-à-vis all foreigners by foreign country, including related-offices.

Residency-based statistics is ill-suited to assess bi-lateral linkages of US banks as confounding resident foreign and domestic banks does not allow to disentangle the different lending conducts and funding structures4. Also, the foreign counterparty includes foreign branches and subsidiaries of domestic banks as well as parents, branches and subsidiaries of foreign banks resident in the US, hindering a full understanding of the geography of banks’ funding, liquidity and capital allocation.

The aim of this paper is to review all the available data at the macro level in order to both draw a map of the bilateral international balance sheet positions of US banks by counterparty country and stress the data limitations and gaps. Firstly, this paper presents an extensive survey of all available bilateral macro data on international linkages created by US banks’ balance sheets. This investigation details the components and measurements (consolidated vs. unconsolidated data collection) of external positions of US banks. The survey is mainly based on the statistics provided by the Country Exposure Lending Survey (CELS) published by the Federal Financial Institutions Examination Council (FFIEC), upon which the BIS CBS for the US is based, and the US Banking claims and liabilities statistics published by the Treasury International Capital System (TICS). The second part of the paper discusses how data gaps might distort the measurement of important bilateral linkages and suggests how these limitations might be tackled by future research.

In the literature can be found a few papers that bring together existing available datasets to evaluate bi-lateral financial linkages, such as the works by (Lane & Milesi-Ferretti, 2011), (Milesi- Ferretti, et al., 2010) and (Cerutti, 2013). The latter study, in particular, estimates the linkages created by banks’ balance sheet by combining BIS CBS with foreign office data available commercially at the micro-level with the intent of measuring foreign rollover risks.

In this paper it is stressed that consolidated and unconsolidated banking statistics should both include a vis-à-vis country dimension, other than a sectoral and instrument-type segmentation. Moreover, statistics should be segmented enough to allow mapping unconsolidated to consolidated data. In particular, consolidated banking statistics should differentiate claims booked from domestic offices to those from branches and subsidiaries, possibly by host country. Unconsolidated statistics, should disentangle positions booked from domestic banks and foreign banks and vis-à-vis related- offices, possibly identifying the nationality foreign banks. While the statistics enhancements of the CGFS are definitely going towards this direction, this paper suggests that more detailed information should be collected on the funding structure of foreign-related offices, disentangling, when possible, branches by subsidiaries by host country.


An overview of bi-lateral foreign exposure of US banks

The linkages created by banks via their international balance sheet positions can be assessed on either a consolidated or unconsolidated basis.

The BIS provides the framework to collect international banking claims on a consolidated basis. The Consolidated Banking Statistics (CBS) provides very useful scope for assessing country risk as its concern is to measure the exposure of the banking sector of a given country i on a foreign country j on a nationality basis: banks are grouped according to their nationality so that all branches of banks with nationality i located worldwide report their positions vis-à-vis the residents of a given country j. Total foreign exposure, namely foreign claims, of the banking sector in i on country j is obtained by summing the consolidated cross-border claims on unaffiliated foreigners in j and local claims of foreign offices established in j. The BIS publishes bilateral foreign claims for the reporting county vis-à-vis the rest of the world by country of location of the counterparty on a quarterly basis. For the US case, more detailed data is available from the Country Exposure Lending Survey (CELS) published by the Federal Financial Institutions Examination Council (FFIEC), upon which the BIS CBS for the US is based.

Banks’ foreign exposure evaluated on an unconsolidated (or locational) basis, on the other hand, complies with the balance of payments principles. Banks are grouped according to their residency so that in a given country i the reporting banks are all those institutions operating in i, including the resident branches of foreign banks. Total foreign exposure is here calculated by measuring unconsolidated cross-border claims only, i.e. claims on all those counterparties which are not domestically located, including related offices. The BIS collects quarterly statistics on unconsolidated banking assets and liabilities, that is, the Locational Banking Statistics (LBS), for a large set of reporting countries, reporting positions broken down by currency, counterparty sector and nationality of banks. Although the BIS collects unconsolidated banking statistics by country of location of the counterparty (i.e. vis-à-vis country dimension), this information is not publicly disclosed hindering a geographical mapping of the counterparties of reporting banks. For the case of US, however, this bilateral assets and liabilities of banks on an unconsolidated basis are published by the US Treasury within the Treasury International Capital System (TICS), upon which the BIS LBS for the US is based.


Data Gaps identified during the GFC have been corrected to some extent.  New improved data sets became available in 2015.  Based on this new data, several new papers have been published by BIS.


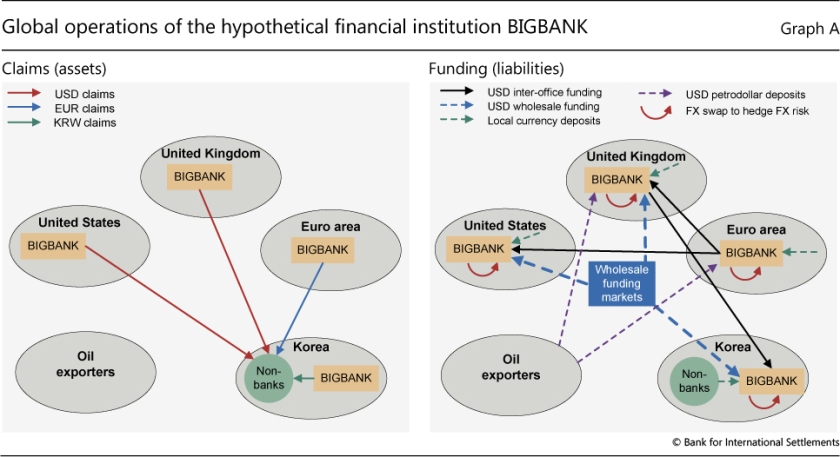
From Enhanced data to analyse international banking

Banks have become larger and more complex over the past 25 years, offering multiple services and products through operations spanning the globe. Some rely heavily on wholesale or non-deposit sources of funding, often from non-bank financial intermediaries about whom information is sparse. Such changes in the international financial system were not well captured in historical data (BIS (2011)). This made it hard to analyse where, in which instruments and on which side of banks’ balance sheets vulnerabilities might emerge, and harder still to assess how vulnerabilities in one part of the financial system might affect other parts. In 2012, the Committee on the Global Financial System (CGFS), which oversees the collection of the BIS international banking statistics (IBS), approved a major set of enhancements to the IBS aimed at filling long-standing data gaps and better capturing the new financial landscape (CGFS (2012)). To a large extent, the enhancements were informed by the Great Financial Crisis of 2007–09, which revealed critical gaps in the information available to monitor and respond to financial stability risks.2 The basic thrust of the enhancements is twofold. First, they expand the coverage of banks’ balance sheets to include their domestic positions, not just their international activities. Second, they provide more information about the sector of banks’ counterparties, in particular banks’ exposures to and reliance on funding from non-bank financial counterparties. The remainder of this feature explains the enhancements in more detail and discusses a few analytical uses of the new data.


Overview of the enhancements

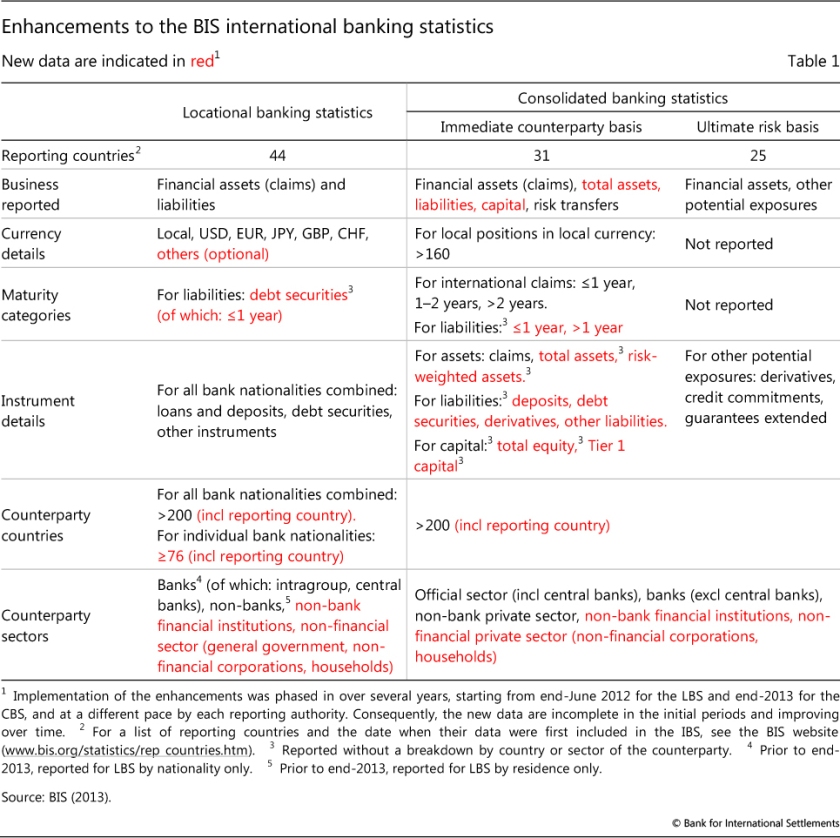
The IBS comprise two data sets – the locational banking statistics (LBS) and the consolidated banking statistics (CBS) – each collected using a different methodology. Jointly, they are a key source of information for assessing risks to financial stability, understanding banks’ role in the transmission of shocks across borders, and monitoring changes in internationally active banks’ business models. The principal use of the LBS is to analyse capital flows between countries. They capture the positions of banking offices located in 44 reporting countries on counterparties resident in each of over 200 countries. The LBS are collected following the same principles as national accounts and balance of payments, meaning that their compilation is based on the residence of entities and the data are not adjusted for intragroup or intrasector links. The CBS provide measures of internationally active banks’ country risk exposures. In contrast to the LBS, the CBS are compiled on a nationality basis, using the consolidated approach followed by banking supervisors. The business of offices that are part of the same banking group is consolidated and reported by the country where the controlling parent entity is located.3 Table 1 summarises the breakdowns reported in each data set, and a companion piece in this Review describes the LBS and CBS in more detail. The enhancements approved by the CGFS focused on five areas. First, in both the LBS and the CBS, the coverage of banks’ balance sheets was extended to domestic positions; previously, the data sets captured only banks’ international business. In the LBS, banks are now asked to report their local positions – positions against residents of the country where they are located – in local currency, to complement the existing data on local positions in foreign currencies.4 In the CBS, since end-2013, internationally active banks have reported their worldwide consolidated claims on residents of their home country – the country where the bank’s controlling parent is headquartered. Second, in the CBS, data for the funding side of banks’ consolidated balance sheets were introduced. Previously, very little liability-related information was collected in the CBS: only the local liabilities of banks’ foreign affiliates, and only those denominated in local currency. Since end-2013, banks have reported their total liabilities on a consolidated basis, with a breakdown by instrument.5 They also report their total equity, selected capital measures, and total assets (comprising financial and non-financial assets).

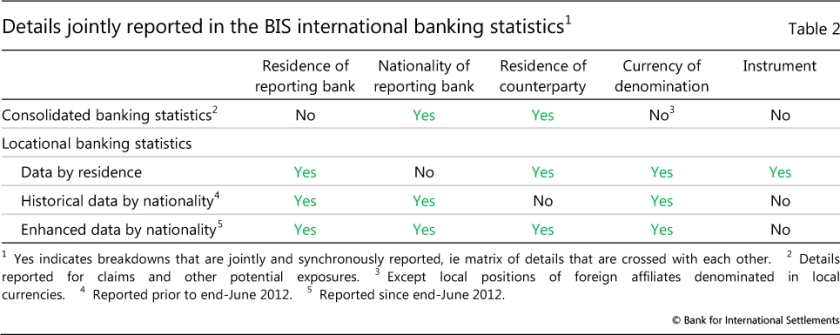
Third, in both the LBS and the CBS, the sectoral breakdown of counterparties was improved. The main improvement was to distinguish between non-bank financial counterparties and non-financial counterparties; previously, the two sectors were grouped together as non-bank entities.6 Banks are also asked to distinguish between different non-financial counterparties: non-financial corporations, households and governments. However, the reporting of the latter breakdown is encouraged, not required, and thus is incomplete (as discussed below). In the LBS, the breakdown of counterparties classified as banks was also improved. Since end- 2013, banks have reported different types of bank counterparties – related banking offices (or intragroup affiliates), unrelated banks and central banks – by residence of the counterparty.7 Fourth, the LBS were refined to provide more granular information by nationality of the reporting bank. In particular, since end-June 2012, four dimensions of data have been jointly reported: the residence and nationality of the reporting bank, the residence of the counterparty, and the currency in which positions are denominated. Previously, no more than three of the four dimensions were jointly reported in either the CBS or LBS (Table 2). Box 1 explains how these new data help clarify the geography of banks’ operations. The more granular information by nationality of the reporting bank is often composed of data reported by very few banks. For example, there are many banks in the United Kingdom that have claims on South Africa, and there are several Australian banks that have offices in the United Kingdom, but there may be only one or two Australian banks in the United Kingdom that have claims on South Africa. If an aggregate comprises data from only one or two banks, then its disclosure risks revealing proprietary information about those banks’ activities. Consequently, reporting authorities classify a significant part of the enhanced data that they report to the BIS as confidential. Such data cannot be disclosed by the BIS, but they can serve as building blocks in the construction of published aggregates that combine data from many reporting countries. While the enhancements made the residence and nationality of reporting banks and the residence of counterparties available simultaneously in the LBS, they did not make the distinction between data by residence and nationality redundant. In particular, the instrument breakdown – loans and deposits, debt securities and other instruments – continues to be reported only for LBS by residence (Table 2). The enhancements also refined the IBS in a number of smaller ways. Banks reporting the LBS are now encouraged to provide an expanded currency breakdown. To complement the LBS by nationality of reporting bank, data by type of bank – branch or subsidiary – are also reported, although without a detailed counterparty country breakdown of cross-border positions. In addition, the quality of the data was improved through closer alignment of reporting practices with the guidelines. For example, authorities in some reporting countries refined sectoral or other classifications. Such methodological changes have sometimes led to significant changes in reported outstanding positions. Finally, the BIS comprehensively revised the tables presenting the IBS so as to include data collected as part of the enhancements (Box 2). The enhancements also prompted the BIS to revisit the way in which some aggregates are calculated or presented, resulting in changes to previously published data (Box 3).


From Enhanced data to analyse international banking

06-tab1


From Enhanced data to analyse international banking

06-tab2


From Enhanced data to analyse international banking

06-graa


From Recent enhancements to the BIS statistics

Locational banking statistics by reporting country

One of the enhancements to the international banking statistics (IBS) agreed by the Committee on the Global Financial System following the Great Financial Crisis of 2007–09 was to make the IBS more widely available (CGFS (2012)). The new tables and data published by the BIS in September 2015 were an important step in that direction (Avdjiev et al (2015)). The BIS and central banks continue to work towards publishing more data and improving the tools for accessing them.

Concurrently with this Quarterly Review, the BIS has started publishing more details at the reporting country level from the locational banking statistics (LBS), in particular the claims and liabilities of banks in individual reporting countries on counterparties in more than 200 countries. Previously, the BIS had made public only two types of aggregates in the LBS: the positions of banks in all reporting countries on counterparties in individual countries (Table A6 in the BIS Statistical Bulletin and the BIS Statistics Explorer), and the positions of banks in individual reporting countries on all counterparties abroad (Table A5). The BIS now discloses a matrix of reporting countries and counterparty countries, for the full history of the LBS. For example, whereas previously only the cross-border claims of all LBS-reporting banks on borrowers in China were published, now the location of those reporting banks is also disclosed. This information shows that, at end-March 2016, banks in Hong Kong SAR were the main creditors, accounting for 42% of cross-border claims on China’s mainland borrowers, followed by banks in Chinese Taipei with 9%.

Such geographical details can be used to analyse how shocks might propagate across sectors and borders. For example, they can help track how funds are transferred from sources in one country via banks to users in another. They can also shed light on the complexity of banks’ international operations.

When undertaking such analysis, it is very important to distinguish between the unconsolidated office-level view in the LBS and the consolidated group-level view in the consolidated banking statistics (CBS). The LBS capture the positions of banking offices located in a given country, following the same residency principles as national accounts and balance of payments. By contrast, the CBS capture the worldwide positions of banking groups headquartered in that country, using the consolidated approach followed by banking supervisors. Accordingly, the principal use of the LBS is to analyse capital flows between countries, whereas the CBS provide measures of banks’ country risk exposures.3

The published matrix of reporting countries and counterparty countries covers the cross-border positions of banks located in up to 29 LBS-reporting countries on counterparties in more than 200 countries. As many as eight series are publicly available in the LBS for each reporting-counterparty country pair: total claims and liabilities on counterparties in all sectors and the non-bank sector, and the same details for the instrument component loans and deposits. Selected series are published in Table A6 of the BIS Statistical Bulletin, and all the data can be downloaded from the BIS Statistics Explorer, the BIS Statistics Warehouse or in a single CSV file. A matrix of reporting countries and counterparty countries is also published for the CBS, in Table B4 of the BIS Statistical Bulletin.


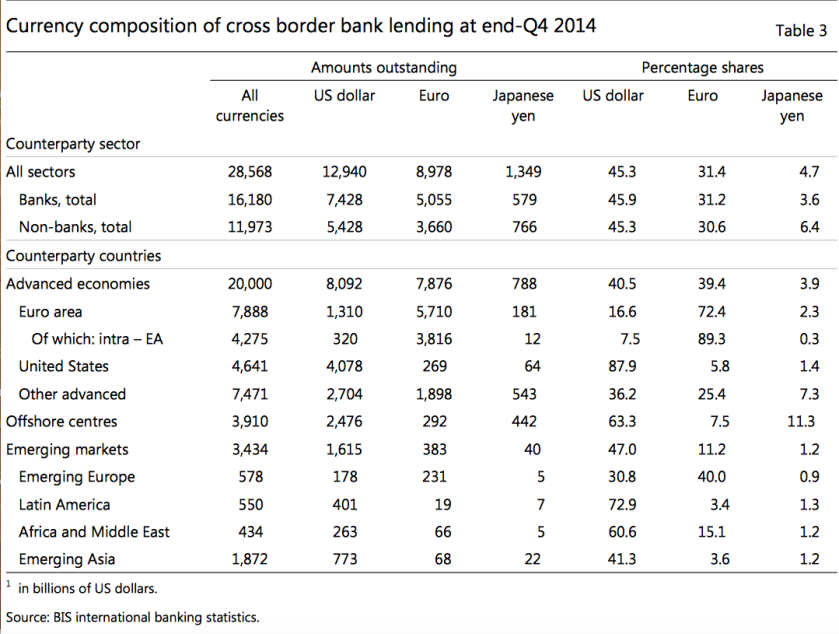
Table below shows stock positions in different currencies by location and by sector.

From Currency networks in cross-border bank lending

crossborder3


From Currency networks in cross-border bank lending

At end-2014, the outstanding stock of BIS IBS cross-border bank claims totalled $28.5 trillion. Using the new dimensions in the Stage 1 data, we can simultaneously identify the nationality of the lending bank and the location of the borrower for 92% ($26.2 trillion) of the global total. Nearly three quarters ($19.3 trillion) of the bilaterally-identified claims represented lending by banks from advanced economies (AEs) to borrowers in AEs (Table 2). The second largest component of global crossborder bank lending was the one from AE banks to offshore centres – it stood at $3.5 trillion (or 13% of the global aggregate). “AE-to-EME” lending (ie lending by AE banks to EME borrowers) was also substantial – it amounted to $2.3 trillion (or 9% of global cross-border lending). Meanwhile, cross-border lending by EME banks, which has been growing rapidly over the past few years, stood at $1.1 trillion or around 4% of global cross-border claims. It was fairly evenly distributed among borrowers from AEs ($395 billion), EMEs ($351 billion) and offshore centres ($205 billion).

Currency networks

More than three-quarters of global cross-border claims were accounted for by lending in two major currencies: the US dollar and the euro. Claims denominated in US dollars alone equalled $13.0 trillion, or 45% of the global total. Meanwhile, crossborder lending denominated in euros stood at $9.0 trillion, or 31% of the global aggregate. The third largest currency denomination, the Japanese yen accounts for only around 5% of the global total. At the aggregate level, the above currency shares are remarkably stable across counterparty sectors (Table 3). The US dollar shares of global cross-border lending to banks (46%) and non-banks (45%) are virtually the same. The same is true for the respective euro shares, with both at 31%. In the case of yen, the difference is more pronounced: cross-border lending to non-banks (6.4%) is almost twice as high as interbank lending (3.6%).

The variation in the currency composition of cross-border lending across locations is considerably larger (Table 3). In terms of lending to advanced economies, the US dollar and euro shares are roughly equal at 41% and 39%, respectively. Approximately half of US dollar-denominated bank lending to advanced economies is accounted for by cross-border claims on residents of the United States ($4.1 trillion). Similarly, the majority ($5.7 trillion) of euro-denominated cross-border bank lending is directed towards borrowers in the euro area – and most ($3.8 trillion) of that amount represents intra-euro area cross-border claims. Outside the United States and the euro area, the US dollar and the euro still dominate lending to advanced economies, albeit with somewhat smaller shares (36% and 25%, respectively).

Lending to EMEs tends to be primarily denominated in US dollars as well. The proportion of cross-border claims on EMEs denominated in US dollars (47%) is more than four times higher than that of the euro (11%). Nevertheless, the aggregate EME numbers mask considerable variations across regions. The US dollar accounts for the majority of the claims on Latin America and on Africa and the Middle East (73% and 61%, respectively). Yet, it accounts for less than half (41%) of the lending to emerging Asia and less than a third (30%) of the lending to emerging Europe. In fact, emerging Europe is the only EME region where the euro is the leading currency with around 41% of all claims. The share of yen is negligible at around 1% of lending to all four EME regions.

The dominance of the US dollar is most pronounced in cross-border claims on offshore centres with a share of nearly two thirds (63%) of the total. Conversely, the respective share for the Japanese yen is merely 11%. The share of the euro is even smaller at 8%.


From Drivers of cross-border banking since the Global Crisis

Since the Global Crisis, international credit markets have become more segmented. Figure 1 illustrates the development of cross-border bank claims over the last years; after a continuous and steep increase, the Crisis has led to a retrenchment in cross-border bank lending. Yet, international lending has evolved heterogeneously across regions. While cross-border lending to developing and emerging economies has increased again, foreign bank claims to developed countries have rather continued to decrease.

Even if part of the retrenchment in cross-border bank claims was cyclical, part of the adjustment seems to be structural as the economic recovery did not go along with a notable increase in total foreign bank claims.

What role do policy changes play for adjustments in cross-border bank claims?

The adjustments in international bank lending have led to a debate on how recent policy interventions have affected international capital flows in the aftermath of the crisis.

  • On the one hand, different observers stress the role of changes in financial regulation for the international activities of banks.

After the experiences of the recent Crisis, national regulators may aim at a lower degree of banking globalisation to facilitate the resolution of large, internationally active banks, and hence to better protect taxpayers from potential losses (The Economist 2012). Using bank-level data for the UK banking sector, Rose and Wieladek (2011) have analysed the implications of bank nationalisations for international lending. They present evidence that foreign banks that profited from government support have cut back their lending to the UK. Thus, part of the retrenchment in international bank lending may be due to increased financial protectionism since the crisis.

  • On the other hand, the effects of monetary policy on capital flows – especially to emerging markets – have been intensely debated.

Among others, Bernanke (2013) has pointed out that in an environment of low interest rates, banks may tend to lean their foreign activities towards higher-yielding markets. Nier and Saadi Sedik (2014) point out that managing the large and volatile capital inflows since the Crisis has been costly for emerging markets.

In a recent study (Bremus and Fratzscher 2014), we add to this debate by investigating the effects of policy-related drivers of changes in cross-border bank lending since the Global Crisis.

  • The first question we address is how shifts in banking regulations have affected international bank lending in the wake of the Crisis.

As illustrated by Figure 2, bank capital regulation has, on average, become stricter since the Crisis. In general, tighter regulatory requirements may have different implications for banks’ international lending business. An increase in capital requirements in the source country of cross-border credit may lead to a reduction in credit outflows if banks cut back risky foreign lending activities in order to deleverage. However, stricter regulations in the source country could also lead to an increase in foreign lending activities to countries where regulation is more lenient. Using data from the pre-crisis period, Houston et al. (2012) indeed find that differences in banking regulation are important push and pull factors of cross-border bank lending; banks are attracted by countries with a less restrictive regulatory environment.

In order to study policy-related drivers of changes in international lending between the pre- and the post-Crisis period, we use bilateral credit data for 46 countries from the Bank for International Settlements for the period 2005-2012.[1] Information on capital stringency, supervisory power, and supervisory independence is available from Barth et al. (2013). Following the literature, the years until 2007 can be classified as the ‘pre-crisis’ period, while the years as of 2010 are classified as the ‘post-crisis’ phase. We use a cross-sectional regression model where all variables are expressed as the change between the average across 2005-2007 and the average across 2010-2012.

  • Our results indicate that regulatory policy has been an important driver of adjustments in cross-border banking since the Global Crisis.

Source countries of bilateral credit which have seen a larger increase in supervisory power or independence have extended more cross-border credit. Put differently, the more independent or powerful supervisors got, the less severe was the reduction in cross-border credit in the aftermath of the Crisis. Another interpretation for this result is that stricter regulation in the source country has led to more cross-border lending due to regulatory arbitrage.

With respect to bank capital regulation, the estimation results are similar when the whole country sample is considered. Yet, the larger the differential in capital stringency between the source and the recipient country of cross-border credit in the Eurozone got, the lower the increase (or the larger the reduction) in cross-border lending between these countries.

  • In a second part, we examine which role expansionary monetary policy – as measured by reserve deposits of commercial banks held at central banks – has played for bilateral cross-border lending.

Aggregate reserves at central banks reflect the size of monetary policy interventions (Keister and McAndrews 2009). The more accommodative monetary policy has been since the Crisis, the larger was the increase in total reserves. The estimation results reveal that a larger expansion in source countries’ reserve deposits have come along with smaller reductions (or, larger increases) in credit outflows. Hence, the findings suggest that monetary policy has mitigated credit market fragmentation in the aftermath of the Global Crisis.

Concluding remarks

Our results show that regulatory and monetary policy changes have been important drivers of adjustments in cross-border bank lending since the crisis. While expansionary monetary policy measures have mitigated credit market fragmentation, regulatory policy changes have had mixed effects, depending on the measure and region considered.

More independent and powerful supervisory authorities tend to promote international lending. Our findings indicate that capital regulation should be adjusted in a harmonised and transparent way in order to avoid distortionary lending behaviour, especially in the Eurozone.


From The currency dimension of the bank lending channel in international monetary transmission

In this paper, we add to the existing literature on the cross-border bank lending channel of monetary policy by examining how the use of a currency in cross-border lending transmits monetary policy-induced monetary shocks across countries. We do so by using new and unique data on bilateral cross-border lending flows across a wide array of source banking systems and target countries, broken down by currency denomination (USD, EUR and JPY).

We obtain three main results.

First, monetary policy-induced monetary shocks in a currency significantly affect cross-border bank lending flows in that currency, even when neither the lending banking system nor the borrowing country uses that currency as their own. This is what we call the currency dimension of the bank lending channel.

Second, we find that this currency dimension of the bank lending channel works primarily through lending to non-banks.

Third, we find that these currency effects work similarly across the three main currencies, that is, the transmission effects are present in EUR and JPY-lending as much as in USD-lending. All these results are robust across our various specifications, including IV estimations.26

We hope that our results will help policymakers and researchers gain further insight into how the global use of currencies transmits monetary policy shocks through the international banking system. In particular, our results suggest that when policymakers in borrowing countries think about external spillovers to their economies they should explicitly consider the currency denomination of the cross-border claims.


KeySources of Research:


Estimating Global Bank Network Connectedness

Mert Demirer Laura Liu

.Francis X. Diebold Kamil Ylmaz


2017


Click to access DDLYpaper.pdf


A network analysis of global banking: 1978–2009

Camelia Minoiu and Javier A. Reyes

2011


Click to access wp1174.pdf


Global Banks and Transmission

2013

Click to access Goldberg.pdf


Crisis Transmission in the Global Banking Network

Galina Hale

Tu ̈mer Kapan

Camelia Minoiu

December 31, 2014


Click to access hale_paper.pdf


Currency networks in cross-border bank lending

Stefan Avdjiev and Előd Takáts

September 2015

Click to access takats_paper.pdf


Monetary policy spillovers and currency networks in cross-border bank lending

by Stefan Avdjiev and Előd Takáts

March 2016


Click to access work549.pdf


WITHDRAWAL FROM CORRESPONDENT BANKING

WHERE, WHY, AND WHAT TO DO ABOUT IT

2015


Click to access 101098-revised-PUBLIC-CBR-Report-November-2015.pdf


Correspondence course: Charting a future for US-dollar clearing and correspondent banking through analytics

2015


Click to access pwc-correspondent-banking-whitepaper.pdf


Correspondent banking

July 2016


Click to access d147.pdf


The Withdrawal of Correspondent Banking Relationships: A Case for Policy Action

Michaela Erbenová, Yan Liu, Nadim Kyriakos-Saad, Alejandro López-Mejía, Giancarlo Gasha, Emmanuel Mathias, Mohamed Norat, Francisca Fernando, and Yasmin Almeida

2016


Click to access sdn1606.pdf


FSB action plan to assess and address the decline in correspondent banking

End-2016 progress report and next steps


19 December 2016


Click to access FSB-action-plan-to-assess-and-address-the-decline-in-correspondent-banking.pdf


Improving the BIS international banking statistics

Click to access cgfs47.pdf


Enhancements to the BIS international banking statistics

Stefan Avdjiev, Patrick McGuire and Philip Wooldridge

2014

Click to access 14-25.pdf


Enhanced data to analyse international banking

Stefan Avdjiev Patrick McGuire Philip Wooldridge

2015


Click to access 15-11a.pdf


Recent enhancements to the BIS statistics

BIS Quarterly Bulletin September 2016

http://www.bis.org/publ/qtrpdf/r_qt1609.htm


Enhancements to the International Banking Statistics

By John Lowes and David Osborn

2015


Click to access art2may15.pdf


Toward a global risk map

Stephen G Cecchetti, Ingo Fender and Patrick McGuire1

Revised Draft May 2010


Click to access 7c8a4bf13bf32eab3fbe47da80875f22fedf.pdf


Bilateral Financial Linkages and Global Imbalances: a View on the Eve of the Financial Crisis

Gian Maria Milesi-Ferretti

Francesco Strobbe

Natalia Tamirisa

This Draft: May 13, 2011


Click to access Milesi-Ferretti_Bilateral%20Financial%20Linkages%20and%20Global%20Imbalances.pdf


Cross-border financial linkages: Identifying and measuring vulnerabilities


Philip R. Lane

2014

Click to access PolicyInsight77.pdf


Global banks turning more local: Improved host countries’ financial stability

Gaston Gelos, Frederic Lambert

17 May 2015

http://voxeu.org/article/global-banks-turning-more-local


Drivers of cross-border banking since the Global Crisis

Franziska Bremus, Marcel Fratzscher

28 January 2015

http://voxeu.org/article/drivers-cross-border-banking-global-crisis


Systemic Risks in Global Banking What Available Data Can Tell Us and What More Data Are Needed?

Eugenio Cerutti, Stijn Claessens, and Patrick McGuire


Click to access c12557.pdf


US Banks’ International Balance Sheet Linkages: A Data Survey

Carmela D’Avino

2014


Click to access MPRA_paper_69422.pdf


G20 Agenda towards a More Stable and Resilient International Financial Architecture

2016


Click to access g20-international-financial-architecture.pdf


Cross-Border Interbank Networks, Banking Risk and Contagion

Lena Tonzer

2013


Click to access N_129-Tonzer.pdf


Developments in a Cross-Border Bank Exposure “Network”

Masazumi Hattori

Yuko Suda

2007


Click to access wp07e21.pdf


Systemic Risks in Global Banking: What Available Data Can Tell Us and What More Data are Needed?

By Eugenio Cerutti, Stijn Claessens and Patrick McGuire

April 18, 2012


Click to access 6798726.pdf


Globalisation and Financial Stability Risks: Is the Residency-Based Approach of the National Accounts Old-Fashioned?

Bruno Tissot


Click to access btissot.pdf


The currency dimension of the bank lending channel in international monetary transmission

Elod Takats and Judit Temesvary

2017-001


Click to access 2017001pap.pdf


Banks and Cross-Border Capital Flows: Policy Challenges and Regulatory Responses

Committee on International Economic Policy and Reform


How the interactions of monetary and regulatory policies may have been ahead of the anti-globalisation backlash
Kristin Forbes, Dennis Reinhardt, Tomasz Wieladek

23 December 2016

http://voxeu.org/article/banking-deglobalisation-spillovers-and-interactions-monetary-and-regulatory-policies


European bank deleveraging and global credit conditions
Erik Feyen, Ines Gonzalez del Mazo

12 May 2013

http://voxeu.org/article/european-bank-deleveraging-and-global-credit-conditions

The Dollar Shortage, Again! in International Wholesale Money Markets

The Dollar Shortage, Again! in International Wholesale Money Markets


During the 2008-2009 global financial crisis, There were many European Banks which got into trouble due to shortage of US Dollar funding in the whole sale international interbank market.  US Federal Reserve eventually extended currency swaps to ECB and other central banks to ease the pressure.

Is it happening now?  There is no banking crisis but there seems to be Dollar Shortage.


Foreign Exposure of European Banks

Liquidity Constraints in Global Money Markets (International Interbank Market)

  • Eurodollar Market

Non US Borrowers got funding from FX Market

  • FX Swap
  • Currency Swap

and Non Bank Sources (Shadow Banking)

  • MMMF
  • ABCP


Funding and liquidity management

Funding can be defined as the sourcing of liabilities. Funding decisions are usually, but not exclusively, taken in view of actual or planned changes in a financial institution’s assets. The funding strategy sets out how a bank intends to remain fully funded at the minimum cost consistent with its risk appetite. Such a strategy must balance cost efficiency and stability. A strategy which targets a broader funding base may entail higher operating and funding costs, but through diversity provides more stable, reliable funding. One which focuses efforts on generating home currency funding may prove more reliable in adverse times but entail higher costs in normal markets. The balance of cost and benefit will reflect a range of factors (see Section 3). Accordingly, funding risk essentially refers to a bank’s (in-)ability to raise funds in the desired currencies on an ongoing basis. Liquidity management is the management of cash flows across an institution’s balance sheet (and possibly across counterparties and locations). It involves the control of maturity/currency mismatches and the management of liquid asset holdings. A bank’s liquidity management strategy sets out limits on such mismatches and the level of liquid assets to be retained to ensure that the bank remains able to meet funding obligations with immediacy across currencies and locations, while still reflecting the bank’s preferred balance of costs (eg of acquiring term liabilities or holding low-yielding liquid assets) and risks (associated with running large maturity or currency mismatches). Accordingly, liquidity risk refers to a bank’s (in-)ability to raise sufficient funds in the right currency and location to finance cash outflows at any given point in time. Funding and liquidity management are interrelated. Virtually every transaction has implications for a bank’s funding needs and, more immediately, for its liquidity management. The maturity transformation role of banks renders them intrinsically vulnerable to both institution-specific and market-related cash flow risks. The likelihood of an unexpected cash-flow shock occurring, and a bank’s ability to cope with it, will reflect not only the adequacy of its funding and liquidity management strategies, but also their coherence under stressed conditions. A bank’s funding strategy will condition liquidity management needs. Hence, the risks embedded in the chosen funding strategy will translate into risks that liquidity management will have to address. Failure to properly manage funding risk may suddenly manifest itself as a liquidity problem, should those sources withdraw funding at short notice. Conversely, inadequate liquidity risk management may place unmanageable strains on a bank’s funding strategy by requiring very large amounts of funding to be raised at short notice.


From The Global Financial Crisis and Offshore Dollar Markets

The Global Shortage of U.S. Dollars

International firms need U.S. dollars to fund their investments in U.S.-dollar-denominated assets, such as retail and corporate loans as well as securities holdings. The funding for these investments is typically obtained from a variety of sources: the unsecured cash markets, the FX swap market, and other shortterm wholesale funding markets.

During the financial crisis, a global shortage of dollars occurred, primarily reflecting the funding needs of European banks. Baba, McCauley, and Ramaswamy (2009) show that European banks had substantially increased their U.S. dollar asset positions from about $2 trillion in 1999 to more than $8 trillion by mid-2007. Until the onset of the crisis, these banks had met their funding requirements mainly by borrowing from the unsecured cash and commercial paper markets and by using FX swaps. Unfortunately, most unsecured funding sources eroded during the crisis. For example, U.S. money market funds abruptly stopped purchasing bank-issued commercial paper after they faced large redemptions associated with the bankruptcy of Lehman Brothers (Baba, McCauley, and Ramaswamy 2009). The reduced availability of dollars resulted in higher dollar funding costs.

The remainder of this article describes the increase in dollar funding costs as reflected in the FX swap market, the primary market enabling global financial institutions to manage multi- currency funding exposures without assuming the credit risk inherent in unsecured funding markets. As liquidity in major unsecured lending markets eroded, the demand for dollar funding through FX swap markets intensified sharply and pushed up the cost of raising dollars through FX swaps. Moreover, heightened demand for dollar funding in conjunction with a reduced willingness to lend dollars noticeably impaired the functioning of the FX swap market, particularly as term liquidity dried up.


Measures of Liquidity Tightening

  • LIBOR-OIS Spread
  • FX Swap implied basis spread


Two Measures

Two measures are used to show the increased cost of dollar funds in private markets during the crisis.

  • The first is the spread between the London interbank offered rate (Libor) and the overnight index swap (OIS) rate.
  • The second measure is the foreign exchange (FX) swap implied basis spread, which reflects the cost of funding dollar positions by borrowing foreign currency and converting it into dollars through an FX swap.


dollarshort2


What are the Money Markets

Wholesale money markets

  • Unsecured cash term deposits and loans
  • Money market calculations and conventions
  • Benchmark rates and their determination
  • Libor
  • Euribor
  • Overnight indexed rates such as Eonia and Sonia
  • Treasury bills (a first look at risk-free)
  • Commercial Paper – CP credit ratings
  • Secured money market loans – sale and repurchase agreements (Repos)


Money market derivatives

  • Short term interest rate futures (STIRs): Eurodollar, Short Sterling and Euribor futures
  • Forward rate agreements
  • Interest rate swaps
  • Overnight index swaps (OIS): Sonia and Eonia swaps
  • Monetary policy and the money markets

How a central bank uses money markets to transmit its interest rate intentions.


OTC US Dollar Money Markets:  Sources of short term Funding

A.  Fed Funds Market (Domestic)

B.  Interbank Money Market

  • Cash Market
  • Market for Short Term Securities
  • Market for Derivatives

Cash Market

  • Unsecured – Eurodollar
  • Secured – REPO
  • Secured (Collateralized markets) – FX Swap Market

Short Term Securities Market

  • T-Bills
  • Commercial Paper
  • Certificate of Deposits

Derivatives Market

  • Interest Rates Swaps


Money Markets in EU

In the unsecured market, activity is concentrated on the overnight maturity segment. The reference rate in this segment is the Eonia (Euro Overnight Index Average). It is a market index computed as the weighted average of overnight unsecured lending transactions undertaken by a representative panel of banks. The same panel banks contributing to the Eonia also quote for the Euribor (Euro Interbank Offered Rate). The Euribor is the rate at which euro interbank term deposits are offered by one prime bank to another prime bank. This is the reference rate for maturities of one, two and three weeks and for twelve maturities from one to twelve months.11

The market for short term securities includes government securities (Treasury bills) and private securities (mainly commercial paper and bank certificates of deposits).

In the market for derivatives, typically interest rate swaps and futures are traded.


Is it happening again?

Policy Decisions such as

  • Rising Interest Rates
  • Stronger Dollar
  • Repatriation of Corporate profits from Europe
  • Unwillingness to extend of CB Swap Lines

can cause liquidity crisis which show up in

  • LIBOR rate
  • Eurodollar rate
  • OIS Rate
  • CIP breakdown
  • EURIBOR
  • TIBOR


Breakdown of CIP – Then and Now


dollarshort4


A brief history of the three key periods of global USD-funding shortfalls:

  • The first episode immediately after the Lehman bankruptcy coincided with a US banking crisis that quickly became a global banking crisis via cross border linkages. Financial globalization meant that Japanese banks had accumulated a large amount of dollar assets during the 1980s and 1990s. Similarly European banks accumulating a large amount of dollar assets during 2000s created structural US dollar funding needs. The Lehman crisis made both European and Japanese banks less creditworthy in dollar funding markets and they had to pay a premium to convert euro or yen funding into dollar funding as they were unable to access dollar funding markets directly.
  • The second episode of very negative dollar basis took place during the Euro debt crisis. The sovereign crisis created a banking crisis making Euro area banks less worthy from a counterparty/credit risk point of view in dollar funding markets. As dollar funding markets including fx swap markets dried up, these funding needs took the form of an acute dollar shortage. European banks and companies that had dollar assets to fund had to pay a hefty premium in fx swap markets to convert their euro funding into dollar funding. Those European banks and companies that were unable to do so, were forced to liquidate dollar assets such as dollar denominated bonds and loans to reduce their need for dollar funding
  • The third phase of very negative dollar basis started at the end of last year. Monetary policy divergence has for sure played a role during the end of 2014 and the beginning of this year. The ECB’s and BoJ’s QE has created an imbalance between supply and demand across funding markets. Funding conditions have become a lot easier outside the US with QE-driven liquidity injections raising the supply of euro and yen funding vs. dollar funding. This divergence manifested itself as one-sided order flow in cross currency swap markets causing a decline in the basis. And we did see these funding imbalances in cross border corporate issuance.


Emergent and Related Issues:

  • Global Liquidity
  • Offshore Dollar Money Markets
  • Eurodollar Market
  • International Lender of Last Resort
  • FX Swaps and Currency Swaps Market
  • Cross border funding
  • International Interbank Market
  • Shadow Banking – MMMF, ABCP,
  • LIBOR EURIBOR TIBOR
  • Covered Interest Parity (CIP) Breakdown
  • OIS LIBOR
  • Wholesale Funding Market
  • Global Credit
  • Credit Markets
  • Impact of Global Liquidity on Global Trade
  • Credit Networks of Global Banks
  • International Investment Positions of Banks
  • Derisking by global banks
  • Decline in Correspondent Banking
  • Shortage of Trade Finance


Why has Global Trade dropped so precipitously since 2014?

Is it because of shortage of US Dollars?


fx17


Key Sources of Research:


“This Is An Extremely Serious Problem” – Dollar Funding Shortage Hits Record In Japan

2016

http://www.zerohedge.com/news/2016-03-17/extremely-serious-problem-dollar-funding-shortage-hits-record-japan


Global Dollar Shortage Intensifies To Worst Level Since 2012

2015

http://www.zerohedge.com/news/2015-10-03/global-dollar-funding-shortage-intesifies-worst-level-2012


Dollar Illiquidity Getting Critical: A $10 Trillion Short Which The Fed Does Not Understand

2016

http://www.zerohedge.com/news/2016-11-16/dollar-illiquidity-getting-critical-10-trillion-short-which-fed-does-not-understand


The VIX Is Dead: According To The BIS, This Is The New “Fear Indicator”

2016

http://www.zerohedge.com/news/2016-11-15/vix-dead-according-bis-new-fear-indicator


New ICC survey finds worsening global shortage of trade finance

http://www.fx-mm.com/52872/news/trading-news/icc-survey-trade-finance/


A ‘dollar shortage’ has returned. This is why

2016

https://www.weforum.org/agenda/2016/10/a-dollar-shortage-has-returned-this-is-why


Dollar shortage *alert* (plus global trade *alert*)

2016

https://ftalphaville.ft.com/2016/11/15/2179675/dollar-shortage-alert-plus-global-trade-alert/


As goes correspondent banking, so goes globalisation

2016

https://ftalphaville.ft.com/2016/07/26/2170875/as-goes-correspondent-banking-so-goes-globalisation/


How do you solve a problem like de-globalisation?

2015

https://ftalphaville.ft.com/2015/09/24/2140786/how-do-you-solve-a-problem-like-de-globalisation/


On the ongoing demise of globalisation

2016

https://ftalphaville.ft.com/2016/10/11/2177071/on-the-ongoing-demise-of-globalisation/


Textbook defying global dollar shortages

2016

https://ftalphaville.ft.com/2016/06/09/2165690/textbook-defying-global-dollar-shortages/


The Coming Dollar Shortage

https://dailyreckoning.com/coming-dollar-shortage/


Dollar Shortage Goes Mainstream: When Will The Fed Confess?

2016

http://www.zerohedge.com/news/2016-11-24/dollar-shortage-goes-mainstream-when-will-fed-confess


The Global Dollar Funding Shortage Is Back With A Vengeance And “This Time It’s Different”

2015

http://www.zerohedge.com/news/2015-03-08/global-dollar-funding-shortage-back-vengeance-set-surpass-lehman-crisis-levels


The US dollar has been on a tear, and that will spell bad news for the rest of the world

http://markets.businessinsider.com/currencies/news/The-US-dollar-has-been-on-a-tear-and-that-will-spell-bad-news-for-the-rest-of-the-world-1001611294


There is a war for capital coming, says UBS

2016

https://ftalphaville.ft.com/2016/02/25/2154339/there-is-a-war-for-capital-coming-says-ubs/


The eurodollar as an economic no-man’s land

2016

https://ftalphaville.ft.com/2016/04/08/2158883/the-eurodollar-as-an-economic-no-mans-land/


Eurodollars, China, TIC data + mysteries

2016

https://ftalphaville.ft.com/2016/03/31/2157947/eurodollars-china-tic-data-mysteries/


Petrodollars are eurodollars, and eurodollar base money is shrinking

2016

https://ftalphaville.ft.com/2016/01/25/2151037/petrodollars-are-eurodollars-and-eurodollar-base-money-is-shrinking/


All about the eurodollars

2014

https://ftalphaville.ft.com/2014/09/05/1957231/all-about-the-eurodollars/


A global reserve requirement for all those eurodollars

2016

https://ftalphaville.ft.com/2016/04/15/2159277/a-global-reserve-requirement-for-all-those-eurodollars/


On the availability of dollar funding

2015

https://ftalphaville.ft.com/2015/04/01/2125661/on-the-availability-of-dollar-funding/


The dollar shortage problem, evaluated

2009

https://ftalphaville.ft.com/2009/08/05/65406/the-dollar-shortage-problem-evaluated/


All about the eurodollars, redux

2015

https://ftalphaville.ft.com/2015/09/24/2140580/all-about-the-eurodollars-redux/


BIS says we should follow the money

2014

https://ftalphaville.ft.com/2014/09/04/1955881/bis-says-we-should-follow-the-money/


Eurodollars, FX reserve managers and the offshore RRP issue

2015

https://ftalphaville.ft.com/2015/09/01/2139085/eurodollars-fx-reserve-managers-and-the-offshore-rrp-issue/


The BoE as eurodollar dealer of last resort?

2015

https://ftalphaville.ft.com/2015/02/20/2119663/the-boe-as-eurodollar-dealer-of-last-resort/


FT:  The Eurodollar Market: It All Starts Here

2016

http://www.zerohedge.com/news/2016-12-04/eurodollar-market-it-all-starts-here


From turmoil to crisis: dislocations in the FX swap market before and after the failure of Lehman Brothers

N Baba

http://www.bis.org/publ/work285.htm


Dollar Funding and Global Banks

Jeremy C. Stein

2012


Click to access stein20121217a.pdf


The US dollar shortage in global banking and the international policy response

by Patrick McGuire and Götz von Peter

October 2009


Click to access work291.pdf


The US dollar shortage in global banking


Patrick McGuire Goetz von Peter

2009

Click to access treasury_1196.pdf


Emergent International Liquidity Agreements: Central Bank Cooperation after the Global Financial Crisis

Daniel McDowell


Click to access mcdowell_eln.pdf


The Financial Crisis through the Lens of Foreign Exchange Swap Markets

Crystal Ossolinski and Andrew Zurawski

2010


Click to access bu-0610-7.pdf


The spillover of money market turbulence to FX swap and cross-currency swap markets

N Baba

2008


Click to access r_qt0803h.pdf


Liquidity Shocks, Dollar Funding Costs, and the Bank Lending Channel During the European Sovereign Crisis

Ricardo Correa, Horacio Sapriza, and Andrei Zlate

2012


Click to access ifdp1059.pdf


GLOBAL INTEGRATION OF BANKING MARKETS: AT WHAT COST?

John L. Simpson


Click to access 00463515e5285b6a85000000.pdf


Systemic risk in the major Eurobanking markets: Evidence from inter-bank offered rates

J.L. Simpson, J.P. Evans

2005


Click to access jou2-2.pdf


The Eurocurrency interbank market: potential for international crises?.

Saunders, Anthony.

Business Review (1988): 17-27.


The Great Liquidity Freeze: What Does It Mean for International Banking?

Dietrich Domanski and Philip Turner

June 2011


Click to access adbi-wp291.pdf


The Euro-dollar market as a source of United States bank liquidity

Steve B. Steib


http://lib.dr.iastate.edu/cgi/viewcontent.cgi?article=6277&context=rtd


The LIBOR Eclipse: Political Economy of a Benchmark

Alexis Stenfors1 and Duncan Lindo

January 2016

Click to access RMF-47_Stenfors-Lindo.pdf


Basics of U.S. Money Markets

2016


Click to access 05.10.2016-moneymarkets-9.15am.pdf


Implementing Monetary Policy – Short-term Money Markets Monitoring

2015


Click to access 09.29.2015-mmarketsv2-1.30pm.pdf


The Dollar Squeeze of the Financial Crisis

Jean-Marc Bottazzia Jaime Luqueb

Mario R. Pascoac Suresh Sundaresand


Click to access 6611902.pdf


Central Bank Dollar Swap Lines and Overseas Dollar Funding Costs


The Global Financial Crisis and Offshore Dollar Markets

Niall Coffey, Warren B. Hrung, Hoai-Luu Nguyen, and Asani Sarkar

2009


https://papers.ssrn.com/sol3/papers2.cfm?abstract_id=1496407


When and how US dollar shortages evolved into the full crisis?: Evidence from the cross-currency swap market

Naohiko Baba* and Yuji Sakurai†

10/27/2009

Click to access sem_paper_0_349_naohiko-baba.pdf


Funding patterns and liquidity management of internationally active banks


http://www.bankingreview.nl/download/23711


The functioning and resilience of cross-border funding markets

2010

CGFS 37

Click to access cgfs37.pdf


The Impact of the Financial Crisis on Cross-Border Funding

Yaz Terajima, Harri Vikstedt, and Jonathan Witme

2011


Click to access fsr-0610-terajima.pdf


Financial Crises and Risk Premiums in International Interbank Markets 

Shin-ichi Fukuda

Mariko Tanaka


Click to access ppr020f.pdf


Dollar Funding and the Lending Behavior of Global Banks

Victoria Ivashina

David S. Scharfstein

Jeremy C. Stein

October 2012

Click to access dollar_funding_october_2012_final.pdf


Financial crises and bank funding: recent experience in the euro area

by Adrian van Rixtel and Gabriele Gasperini

March 2013


Click to access work406.pdf


The Financial Crisis and Money Markets in Emerging Asia

Robert Rigg and Lotte Schou-Zibell

No. 38 | November 2009


Click to access wp38-financial-crisis-money-markets.pdf


Money Market Integration

Leonardo Bartolini Spence Hilton Alessandro Prati


Click to access sr227.pdf


Segmentation in the U.S. Dollar Money Markets During the Financial Crisis

James J. McAndrews

May 19, 2009


Click to access Session2.pdf


Re-thinking the lender of last resort

September 2014


Click to access bispap79.pdf


Towards an International Lender of Last Resort

Stephen G. Cecchetti

September 2014

https://papers.ssrn.com/sol3/papers.cfm?abstract_id=2504732


Global Liquidity: Public and Private

Jean-Pierre Landau


The Global Dollar System

Stephen G Cecchetti

Click to access Polp61.pdf


US dollar money market funds and non-US banks

Naohiko Baba Robert N McCauley Srichander Ramaswamy

2009


Click to access r_qt0903g.pdf


Improving the Resilience of Core Funding Markets

2009

Bank of Canada

Jean-Sébastien Fontaine, Jack Selody, and Carolyn Wilkins


How do Global Banks Scramble for Liquidity? Evidence from the Asset- Backed Commercial Paper Freeze of 2007*

by Viral V. Acharya Gara Afonso Anna Kovner

October 24, 2012


The Financial Crisis and Money Markets in Emerging Asia

Robert Rigg and Lotte Schou-Zibell

No. 38 | November 2009


Regulatory Reforms and the Dollar Funding of Global Banks:

Evidence from the Impact of Monetary Policy Divergence

Tomoyuki Iida

Takeshi Kimura

Nao Sudo

2016


Click to access wp16e14.pdf


Monetary policy spillovers and currency networks in cross-border bank lending

by Stefan Avdjiev and Előd Takáts

March 2016


Click to access work549.pdf


FUNDING LIQUIDITY RISK AND DEVIATIONS FROM INTEREST-RATE PARITY DURING THE FINANCIAL CRISIS OF 2007-2009

Prepared by Cho-Hoi Hui, Hans Genberg and Tsz-Kin Chung

2009


Click to access HKMAWP09_13_full.pdf


Deviations from Covered Interest Rate Parity

Wenxin Du  Alexander Tepper  Adrien Verdelhan

January 1, 2016

https://papers.ssrn.com/sol3/papers.cfm?abstract_id=2768207


Limits to Arbitrage and Deviations from Covered Interest Rate Parity

James Pinnington1 and Maral Shamloo

Click to access sdp2016-4.pdf


Capital Constraints, Counterparty Risk, and Deviations from Covered Interest Rate Parity

Niall Coffey Warren B. Hrung Asani Sarkar

September 2009

Click to access sr393.pdf


Covered interest parity lost: understanding the cross-currency basis

Claudio Borio Robert McCauley Patrick McGuire Vladyslav Sushko

2016

Click to access r_qt1609e.pdf


Bye-bye covered interest parity

Claudio Borio, Robert McCauley, Patrick McGuire, Vladyslav Sushko

28 September 2016

http://voxeu.org/article/bye-bye-covered-interest-parity

Understanding Global OTC Foreign Exchange (FX) Market

Understanding Global OTC Foreign Exchange (FX) Market


OTC FX Market is biggest market in the world.  About 5.1 trillion USD are traded in this market every day.

Originally all FX transactions were for cross border trades in goods and services, but later on developments led to speculative investments activities in foreign currencies.

OTC FX Market is decentralized.  It means there is no exchange on which currencies are traded. Interbank market in FX is among dealer banks.  Dealer Banks are the biggest global banks.  Top 10 banks who trade in FX have total trade volume of 67%.

USD is the dominant currency in global FX market.  UK is the biggest location for FX trading followed by USA and Singapore.  Hong Kong SAR and Japan are other important FX trading centers.

Markets operate 24/7 unlike other financial markets which open and close at certain times.

Bank of International Settlement publishes its triennial survey of global FX markets.  2016 survey showed 5.1 trillion USD/day FX turnover down from 5.3 T/Day back in 2013 survey.  Markets peaked in September of 2014 at 6.5 Trillion USD/day.  Since then the trend is declining.  De-risking by global banks, decline in global trade are cited as main reasons for decline.  Will attempt to understand this issue at a later date.


Following Issues emerge from this post but are not discussed here in detail.

  • Retail FX Market
  • Algorithmic Trading
  • Non Bank High Frequency Liquidity Providers
  • FX  Prime Brokerage
  • Financial Stability in OTC Market – Case for CCP
  • China RMB Internationalization
  • Clearing and Settlement in FX Markets – CLS Bank and CLSNet
  • Liquidity for FX trades – Funding and Market Liquidity


Highlights from the 2016 Triennial Survey of turnover in OTC foreign exchange markets:

  •   Trading in foreign exchange markets averaged $5.1 trillion per day in April 2016. This is down from $5.4 trillion in April 2013, a month which had seen heightened activity in Japanese yen against the background of monetary policy developments at that time.
  •   For first time since 2001, spot turnover declined. Spot transactions fell to $1.7 trillion per day in April 2016 from $2.0 trillion in 2013. In contrast, the turnover of FX swaps rose further, reaching $2.4 trillion per day in April 2016. This rise was driven in large part by increased trading of FX swaps involving yen.
  •   The US dollar remained the dominant vehicle currency, being on one side of 88% of all trades in April 2016. The euro, yen and Australian dollar all lost market share. In contrast, many emerging market currencies increased their share. The renminbi doubled its share, to 4%, to become the world’s eighth most actively traded currency and the most actively traded emerging market currency, overtaking the Mexican peso. The rise in the share of renminbi was primarily due to the increase in trading against the US dollar. In April 2016, as much as 95% of renminbi trading volume was against the US dollar.
  •   The share of trading between reporting dealers grew over the three-year period, accounting for 42% of turnover in April 2016, compared with 39% in April 2013. Banks other than reporting dealers accounted for a further 22% of turnover. Institutional investors were the third largest group of counterparties in FX markets, at 16%.
  •   In April 2016, sales desks in five countries – the United Kingdom, the United States, Singapore, Hong Kong SAR and Japan – intermediated 77% of foreign exchange trading, up from 75% in April 2013 and 71% in April 2010.


Interbank (OTC) Market Infrastructure and Institutions

  • Banks
  • Non Banks
  • Exchanges


Top 10 Banks in FX


fx16


From All change in the 2016 Euromoney FX rankings

Citi holds on to the top ranking in this year’s Euromoney foreign exchange rankings, but elsewhere there have been unprecedented shifts.

Structural changes to the markets, management upheaval among many big banks, new non-bank entrants and lack of volumes and volatility have seemingly levelled the playing field among the industry’s biggest firms.

The biggest change in the rankings this year is the decline of the combined market share of the top five global banks. Their market share in the survey peaked in 2009 at 61.5% and was still above 60% as recently as 2014.

This year the top five banks account for just 44.7% of total volume. The hopes of many global FX heads and their investment bank bosses – that the share of the big banks would rise inexorably as the market became more automated and that they would be able to benefit from oligopolistic pricing power as a result – now seem like distant and deluded dreams.

One FX veteran tells Euromoney that the decline of the top five banks’ combined market share “is exactly what the regulators would want in a market they continue to keep a very close eye on.”

While the market share of the top 10 FX houses overall also declines, from over 75% last year to just 66% this year, the fall is entirely due to the performance of the top five banks. The banks ranked from sixth to 10th place overall produced a combined market share of 22%, roughly in line with the last five years of the survey and considerably higher than the 14% they managed in 2008.

Citi actually extends its lead over the second-placed bank in the survey, which market participants regard as the most accurate reflection of client-based activity in the global foreign exchange markets, to more than four percentage points – even though the bank’s own market share declined by more than three percentage points, from 16.11% in the 2015 survey to 12.91% of trading in 2016.

That winning market share is the lowest for any top-ranked bank in the survey since UBS won the survey in 2004.

Citi maintained its leadership overall in important product areas such as spot/forwards and swaps, as well as in the key real money and bank client categories. It rises one place this year to win in corporates and overall electronic market share, although it falls to third overall for options.

One big story in this year’s rankings is the decline of Deutsche Bank. It was once the undisputed leader in global foreign exchange, losing the top position in the Euromoney rankings three years ago after nearly a decade of dominance.

While new group CEO John Cryan has gone out of his way both publicly and privately to describe the FX business as one of the beleaguered bank’s crown jewels, the days when Deutsche Bank was able to secure an overall market share of more than 20% (as recently as 2009) are long gone.

In the latest set of rankings, Deutsche falls from second to fourth place overall: its market share of 7.86% is almost half what it was a year ago. Deutsche’s decline is widespread, and competitors say has been driven in part by the bank cutting back on the number of clients it covers. It falls from second to fifth in spot/forward; from second to eighth among real money clients and loses top spot among bank clients. It remains the leading overall options house.

Perhaps the most surprising fall of all is in its overall electronic market share. Deutsche’s Autobahn system revolutionized global FX trading and in banner years accounted for more than a quarter of all electronic trading. This year, Deutsche can only manage fourth place in e-market share, from holding the top ranking last year, and its share has fallen from 17.5% to 8.73%.

Two banks overtake Deutsche to move into the top three overall, but the similarities end there: the two banks in question have very different recent histories in global foreign exchange.

JPMorgan jumps to second place in the survey, with a market share of 8.77%, up from fourth place with 7.65% last year. For many years, competitors have said that JPMorgan has failed to punch its weight in FX; it has typically ranked outside the top five overall banks in the Euromoney survey for the last decade. Those accusations have less weight now, even though they have been replaced by rumours about the bank’s competitive pricing strategy.

The US bank rises across a range of categories. Its most notable successes are winning the leveraged fund category with a lead over second-placed UBS of almost eight percentage points and a market share of more than 18%; and jumping from fifth to second place in overall electronic trading. JPMorgan’s one poor ranking is now in options, where it comes a lowly eighth.

UBS returns to the top three global FX banks overall this year. A winner back in 2004, it has been outside the top three since 2009, and last challenged for the top spot overall a year earlier, when its market share of almost 16% was only beaten by Deutsche. Last year it fell to fifth place, its worst performance in a decade, with a market share of 7.3%.

Given the bank’s leadership has spent the last few years de-emphasizing the role of its investment bank, some competitors believed UBS was on a long, slow decline in FX.

But, quietly and consistently, UBS’s markets business has been recalibrating to the new capital and markets environment, as well as maintaining a commitment to best-in-class electronic platforms. Its overall market share rises to 8.76%; and it breaks into the top three overall in spot/forward, swaps, electronic market share and for bank clients. Like JPMorgan, it is a laggard in options, where it ranks seventh.

JPMorgan and UBS have one other important thing in common: while other banks have lost entire benches of senior management from their FX teams in recent years, JPMorgan and UBS have been relatively stable.

At the former, Troy Rohrbach has overseen the FX business since 2005 (he now also runs rates and public finance globally); at UBS, Chris Murphy and George Athanasopoulos, the global co-heads of FX, rates and credit, both joined the bank more than five years ago and have jointly run the division since 2013. Leadership, it seems, does count.

Bank of America Merrill Lynch continues its steady rise up the rankings of recent years, from a nadir of 12th place from 2009 to 2012. It finally breaks into the top five global FX houses overall, up from sixth place last year.

BAML jumped up the rankings into the top five for corporates and real money accounts, and gained ground in both swaps and options – in the latter, it ranks second globally. But BAML still has work to do in the electronic market, where its overall ranking fell from sixth to seventh place. Other US banks also performed well.

Goldman Sachs rose from ninth to seventh overall and Morgan Stanley jumped three places to break back into the top 10.

It has not been a good year in FX for Barclays. Perhaps the bank’s decision to not have a global head of foreign exchange has backfired. The UK-cum-transatlantic bank dropped from third place overall to sixth, and its market share from 8.11% to 5.67%.

Barclays slipped three places to seventh in spot/forward, four places to seventh in swaps and three places to ninth in options. Among client groups, its biggest reversal came among real money accounts, falling from fourth place last year to outside the top 10.

HSBC has also had a disappointing year, falling from seventh to eighth place overall. It also loses its top ranking among corporates last year, falling out of the top five of that client category altogether. Electronic trading remains the bank’s weakest link, and may even be getting weaker, as the bank falls to ninth place in overall e-market share.

New phenomenon

Banks have always risen and fallen in the Euromoney rankings over the last 40 years, but this year sees a new phenomenon – the advent of the non-bank liquidity provider. Leading the way is XTX Markets, a spin-off of GSA Capital, whose co-CEO Zar Amrolia was a frequent winner of the Euromoney FX rankings in his previous role as head of Deutsche Bank’s FX business.

In its first year of eligibility, the spot-only XTX makes a stunning debut: ninth place in the overall rankings with a market share of 3.87%; fourth in spot/forwards; fifth for bank clients; third for FX trading platforms; fifth overall for e-market share; and third for electronic trading of spot, ahead of Deutsche Bank with a market share of more than 10%.

XTX is the leader, but not the only non-bank entrant to the survey. Tower Research Capital, Jump Trading, Virtu Financial, Lucid Markets and Citadel Securities all make the top 50 overall market share rankings.

XTX’s ninth place overall looks like a line in the sand for the FX markets. The banks above it are, for the most part, the remaining price-makers; the banks below often price-takers, with the ability to make markets in particular currencies or products.

Many of the banks ranked outside the top 10 overall this year are understood to be sourcing liquidity from non-bank providers such as XTX, Tower and Jump. They look set to gain more market share in the future, helped by new technology, more defined business models and a lower-cost infrastructure base than the traditional FX banks. They could look to build capability in forwards and other markets in the near future.

Among multi-dealer platforms, Thomson Reuters – through its FXall service – remains the clear leader with a 30% market share, although its margin over second-ranked FXConnect almost halved. The big riser among MDPs was third-ranked HotspotFXi, which increased its market share from less than 7% to almost 18% this year.

Total volumes in the Euromoney FX survey came in at almost $95 trillion, while the number of votes held steady compared with last year at around 3,500 clients. That represents a volume fall of around 23% on last year, in line with market expectations.


Electronic FX platforms 

There are three types of trading platforms.

  • Interdealer
  • Multidealer
  • Singledealer


Trading platforms can be divided into three different types:

  • Inter-dealer electronic broking platforms. These platforms were developed in the 1990s and are regarded, according to the Bank for international Settlements (BiS, 2010), as the dominant source of interbank liquidity on the foreign exchange market. They mediate information on various market makers’ indicative prices. EBS and Reuters, based in London, are the two dominant platforms within this category.
  • Multi-bank platforms. These platforms are also known as multi-bank ECNs (electronic communication networks). They were created in the first decade of this century and resemble the previous category in that they mediate several market makers’ prices. one difference is that they have freer access regulations for market makers, which makes it easier for market makers to join these platforms. Another difference is that they are largely used outside the interbank market, which is to say by market participants that are not banks. The US platforms Fx All, currenex, Hotspot Fx, State Street and Fx connect are examples of this type of trading platform. There are also platforms that provide standardised algorithmic trading functions as a service. currenex is one such platform.
  • Single-bank platforms. This type of platform is run by an individual bank. The platform mediates only the individual bank’s own prices for various currency pairs, unlike the trading platforms discussed above, which mediate several market makers’ prices. in Sweden, SeB has a platform of this type, SeB Trading Station. other examples of banks with such platforms are JP Morgan, Deutsche Bank and citibank.


A. Multi Dealer Platforms

J.P. Morgan has significantly increased its footprint on these platforms over the past couple of years and now ranks first for penetration globally, followed closely by Citi. Bank of America Merrill Lynch, Deutsche Bank and HSBC round out the top five most prominent banks on MDPs.

B. Single Dealer Platforms

While multi-dealer systems are clearly on the rise, an average of more than 20% of trading volume of banks and hedge funds is still executed on single-bank platforms. Barclays, Citi and Deutsche Bank are the clear top three most actively used single-dealer platforms globally.

“Proprietary platforms give banks a means of retaining profitable trading volumes, so dealers are expanding these systems to provide a range of liquidity choices that enable clients to access the market in a variety of ways, including disclosed and non-disclosed liquidity, agency and principal trades, and links to exchange-based execution,” says Greenwich Associates Managing Director Woody Canaday.

C. Algorithmic Trading

Dealers are also in the early days of what promises to be an all-out arms race in algorithmic trading. Currently only 13% of top-tier FX customers use algorithmic trading models. However, that share approaches one-quarter among the market’s biggest buy-side participants and 30% among hedge funds.

Two trends suggest that algorithmic trading is gaining traction in FX. First, market participants that use algo-rithmic models are tapping an expanding number of dealers for algorithms. Second, current users are routing growing shares of trading volume through the models, from 25% in 2014 to 28% in 2015. Hedge funds that trade algorithmically now use these models for about half of total trading volume.


A.  Inter-dealer electronic broking platforms

  • Reuters Dealing 3000
  • ICAP EBS

EBS is the primary trading venue for EUR/USD, USD/JPY, EUR/JPY, USD/CHF, EUR/CHF and USD/CNH.

Thomson Reuters Matching is the primary trading venue for commonwealth (AUD/USD, NZD/USD, USD/CAD) and emerging market currency pairs.


ICAP EBS

EBS was created by a partnership of the world’s largest foreign exchange (FX) market making banks in 1990 to challenge Reuters’ threatened monopoly in interbank spot foreign exchange and provide effective competition. By 2007, approximately US$164 billion in spot foreign exchange transactions were traded every day over EBS’s central limit order book, EBS Market.

EBS’s closest competitor is Reuters Dealing 3000 Spot Matching. The decision by an FX trader whether to use EBS or Thomson Reuters Matching is driven largely by currency pair. In practice, EBS is the primary trading venue for EUR/USD, USD/JPY, EUR/JPY, USD/CHF, EUR/CHF and USD/CNH, and Thomson Reuters Matching is the primary trading venue for commonwealth (AUD/USD, NZD/USD, USD/CAD) and emerging market currency pairs.

EBS initiated e-trading in spot precious metals, spanning spot gold, silver, platinum and palladium, and remains the leading electronic broker in spot gold and silver through the Loco London Market.

They were the first organisation to facilitate orderly black box or algorithmic trading in spot FX, through an application programming interface (API). By 2007 this accounted for 60% of all EBS flow.

In addition to spot FX and Precious Metals, EBS has expanded trading products through its venues to include NDFs, forwards and FX options. It has also increased the range of trading style to include RFQ and streaming in disclosed and non-disclosed environments.

EBS was acquired by ICAP, the world’s largest inter-dealer broker, in June 2006. ICAP said that the acquisition would combine EBS’ strengths in electronic spot foreign exchange with ICAP’s Electronic Broking business to create a single global multi-product business with further growth potential and significant economies of scale. It went on to say that would provide customers with more efficient electronic trade execution, reduced integration costs and give access to broad liquidity across a wide product range.[1]

In 2014, EBS merged with BrokerTec – a leading service provider in the fixed income markets – to form EBS BrokerTec. BrokerTec’s offering comprises trading solutions for many US and European fixed income products including US Treasuries, European Government Bonds and European Repo.

EBS BrokerTec is now recognised as a market-leading e-trading technology and solutions provider, offering access to multiple execution options and diverse, valuable liquidity across the FX and fixed income markets.


  • ICAP EBS is one of the world’s premier inter-dealer brokers with average daily transaction volume in excess of USD 2.3 trillion.
  • ICAP’s electronic EBS platform provides the primary market of natural interest for more than 2800 global FX, Precious Metals and NDF traders.
  • ICAP EBS global access platform delivers anonymous, transparent and reliable FX Liquidity.
  • Authoritative real-time and historical market data.
  • Available for clearing only. Relationship with EBS required.


B. Multidealer Platforms – FX ECNs

Since 1999, banks have been developing proprietary systems for their customers to trade foreign exchange and access research material over the internet. To trade with multiple banks online, customers therefore need to use a variety of authentication methods, websites and price request methods. Multi-bank platforms have evolved to allow customers to use a single website to request prices simultaneously from multiple banks and view research material online. Multi-bank platforms (also known as ECNs or electronic communication networks) offer significant advantages to customers, but fewer advantages to banks, and therefore active participation by banks in multi-bank platforms is driven largely by customer demand. However, for the banks it remains preferable for their customers to trade through bank proprietary systems as the banks avoid paying brokerage and customers are encouraged to focus only on the particular bank’s prices.

There are five main customer-facing FX ECNs:

FXall – founded by Bank of America, Credit Suisse First Boston, Goldman Sachs, HSBC, JP Morgan, Morgan Stanley Dean Witter and UBS

Currenex – independent and venture backed by major market participants, e.g. Barclays Capital and Royal Dutch/Shell

FX Connect – owned by State Street

360T – independent and venture backed by financial and major private investors

Hotspot FXi – independent privately held venture capital-backed company


Currency Trading Shifts to Multi-Dealer Systems, Greenwich Says

Lananh Nguyen
July 14, 2015, 11:28 AM EDT

Currency investors are increasingly using electronic systems connected to multiple dealers as the market comes under greater scrutiny by regulators, according to Greenwich Associates.

Institutional investors and large corporations executed 49 percent of their foreign-exchange trading volumes on multi-dealer platforms last year, up from 45 percent in 2013 and 38 percent in 2008, the Stamford, Connecticut-based consultant said in a report. The increase comes as trading by traditional methods, such as phone, instant messaging and single-dealer platforms, has fallen.

“The FX ‘fixing scandal’ and related bank fines have already played a part in changing buy-side behavior,” wrote Kevin McPartland, head of research for market structure and technology at Greenwich, who co-authored the report based on interviews with more than 1,600 people participating in foreign-exchange markets globally.

Asset-management companies are boosting electronic trading as regulatory scrutiny discourages banks and dealers from providing “market color” to clients to avoid any perception of impropriety, according to Greenwich. The platforms are also becoming more popular as banks become less active in currency markets because of rising capital requirements.

“Asset managers have proactively worked to beef up internal policies to both ensure maximum returns for the impacted funds and to reassure customers, such as pension funds and sovereign wealth funds, that they’re getting the best the market has to offer at that moment in time,” McPartland wrote.

Thomson Reuters Corp.’s FXall platform had the largest volume-weighted share of trading last year at 21 percent, according to Greenwich. It’s followed in popularity by 360T, State Street Corp.’s Currenex, Bloomberg LP’s FXGO and FX Connect.


Dealer-to-client platforms

  • State Street FX Connect
  • Thomson Reuters FXall
  • State Street Currenex
  • CBOE/BATS Hotspot FX
  • Bloomberg FXGO


fx11


C. Single Dealer FX Trading Platforms

  • Barclays BARX
  • Citi Velocity
  • Deutsche Autobahn
  • Morgan Stanley Matrix
  • UBS Neo


Best Single-Dealer FX Trading Platform

Financial News is delighted to announce the . The winners will be announced at a gala dinner in London in October.

Here are the nominees in the category of Best Single-Dealer FX Trading Platform:

Barclays BARX
The BARX platform remains a dominant force among single-dealer platforms, with streaming prices in more than 80 currencies and 480 currency pairs, with a wide range of products available. Following the launch of BARX Gator, a liquidity aggregator, Barclays now gives clients access to the increasingly popular agency-style of execution.

Citi Velocity
Since its relaunch in 2012, Citi Velocity 2.0 has become a leading source of single-bank liquidity in FX cash, options and rates trading. Citi has also led the adoption of mobile and tablet technology in this space, and has focused its efforts with Velocity on delivering speed, lower transaction costs, cross-asset information, cross-asset trading, deep liquidity, and desktop efficiency.

Deutsche Bank Autobahn
Deutsche Bank has channelled significant resources into its electronic trading franchise in recent years, and Autobahn remains a major player across asset classes. In FX, Autobahn provides a single blotter for trades executed via both voice and electronic channels. Users can thus benefit from a combined view and take greater control over their portfolios.

Morgan Stanley Matrix
While not a top-tier bank in FX, Morgan Stanley has sought to add unique value with its Matrix platform. That has been achieved in part through execution and post-trade services, but also through the bank’s quantitative solutions and innovations group, which develops unique analytical tools to help users make more informed trading and investment decisions.

UBS Neo
Launched in 2013, UBS Neo is a cross-asset class platform providing a single point of access with a strong user experience, re-establishing the Swiss bank as a significant player in electronic trading. UBS Neo FX covers 550 currency pairs, with access to cash, NDFs and options available through the platform.


Trends in use of Electronic Platforms

fx10


From The $4 trillion question: what explains FX growth since the 2007 survey?

Electronic execution methods are transforming the FX market The greater activity of all three of the above-mentioned customer types – highfrequency traders, banks as clients and retail investors – is closely related to the growth of electronic execution methods in FX markets. Greenwich Associates estimates that more than 50% of total foreign exchange trading volume is now being executed electronically (Graph 3, left-hand panel).

Electronic execution methods can be divided into three categories: electronic brokers, multi-bank trading systems and single-bank trading systems. Electronic brokers were introduced in the inter-dealer FX market as early as in 1992. For customers, however, the main channel for trading continued to be direct contact with dealers by telephone. In the rather opaque and fragmented FX market of the 1990s, barriers to entry were high and competition was limited. Customers typically paid large spreads on their FX trades.

The first multi-bank trading system was Currenex, which was launched in 1999. By providing customers with competing quotes from different FX dealers on a single page, Currenex increased transparency, reduced transaction costs and attracted a growing customer base. State Street’s FXConnect, which had been launched in 1996 as a single-bank trading system servicing only State Street’s clients, opened up in 2000 and became a multi-bank ECN.

In response to the increased competition, top FX dealers launched proprietary single-bank trading systems for their clients, such as Barclays’ BARX in 2001, Deutsche Bank’s Autobahn in 2002 and Citigroup’s Velocity in 2006. According to data provided to the BIS, daily average trading volumes on the top single-bank trading systems have increased by up to 200% over the past three years.


Market Participants in

  • Interbank Market
  • Retail Market

Forex Market Players

Forex Market

The Forex market is an international over-the-counter market (OTC). It means that it is a decentralized, self-regulated market with no central exchange or clearing house, unlike stocks and futures markets. This structure eliminates fees for exchange and clearing, thereby reducing transaction costs.

The Forex OTC market is formed by different participants – with varying needs and interests – that trade directly with each other. These participants can be divided in two groups: the interbank market and the retail market.

The Interbank Market

The interbank market designates Forex transactions that occur between central banks, commercial banks and financial institutions.

Central Banks – National central banks (such as the US Fed and the ECB) play an important role in the Forex market. As principal monetary authority, their role consists in achieving price stability and economic growth. To do so, they regulate the entire money supply in the economy by setting interest rates and reserve requirements. They also manage the country’s foreign exchange reserves that they can use in order to influence market conditions and exchange rates.

Commercial Banks – Commercial banks (such as Deutsche Bank and Barclays) provide liquidity to the Forex market due to the trading volume they handle every day. Some of this trading represents foreign currency conversions on behalf of customers’ needs while some is carried out by the banks’ proprietary trading desk for speculative purpose.

Financial Institutions – Financial institutions such as money managers, investment funds, pension funds and brokerage companies trade foreign currencies as part of their obligations to seek the best investment opportunities for their clients. For example, a manager of an international equity portfolio will have to engage in currency trading in order to buy and sell foreign stocks.

The Retail Market

The retail market designates transactions made by smaller speculators and investors. These transactions are executed through Forex brokers who act as a mediator between the retail market and the interbank market. The participants of the retail market are hedge funds, corporations and individuals.

Hedge Funds – Hedge funds are private investment funds that speculate in various assets classes using leverage. Macro Hedge Funds pursue trading opportunities in the Forex Market. They design and execute trades after conducting a macroeconomic analysis that reviews the challenges affecting a country and its currency. Due to their large amounts of liquidity and their aggressive strategies, they are a major contributor to the dynamic of Forex Market.

Corporations – They represent the companies that are engaged in import/export activities with foreign counterparts. Their primary business requires them to purchase and sell foreign currencies in exchange for goods, exposing them to currency risks. Through the Forex market, they convert currencies and hedge themselves against future fluctuations.

Individuals – Individual traders or investors trade Forex on their own capital in order to profit from speculation on future exchange rates. They mainly operate through Forex platforms that offer tight spreads, immediate execution and highly leveraged margin accounts.


Trend Towards Exchanges ?

Only 200 billion daily turnover using exchanges


Exchanges are staking out the $5tn a day global currency market as part of their latest efforts to tap this lucrative and booming sector that has long been dominated by global banks.

This week Bats Global Markets, the US’s second largest equities exchange, fired the latest salvo by offering three months of free trading on its forthcoming London-based Hotspot currency trading platform, the centrepiece of Bats’ $365m purchase of the venue from KCG Holdings in March.

That came only days after Deutsche Börse, Europe’s largest exchanges operator, bought 360T, one of the world’s largest currency trading networks, for €725m.

Their moves are audacious attempts to break into the world’s most liquid over-the-counter market, where a notional $5.3tn a day is traded in cash, or spot, and derivatives trades. It is dominated by banks, which continue to make billions of dollars in profits from it each year. Exchanges have generally been unable to establish a presence in this and other OTC markets, despite repeated attempts to do so.

In currencies, Chicago’s CME Group dominates futures trading, reflecting how it seized the terrain in the 1970s when the present era of floating foreign exchanges began. Markets in Moscow, Brazil and India also trade local currency, but of that $5.3tn total, global exchanges account for just $200bn according to Aite Group, a financial markets consultancy.

However, cracks are appearing in the market edifice, brought on by a combination of unlawful activity by banks, deep structural change and the emergence of cheap and reliable technology that has allowed alternative ways of trading to emerge.
“The banks as a whole will continue to have a substantial piece of the pie but the regulations will force them to let go of pieces of it,” says Javier Paz, an analyst at Aite Group.

Waves of post financial crisis regulation have accelerated change in equity and interest rate swaps markets, but global policymakers largely left the currency market alone.

However, the currency industry is mopping up after two of its own existential crises — the Wm/Reuters benchmark rate rigging scandal, which resulted in multibillion-dollar fines for banks, and the sudden move by the Swiss franc in January when the national central bank abolished its ceiling against the euro.

Market observers say that end users such as corporations, hedge funds and asset managers are now taking far more care with their orders, and they have the tools to do it, turning the banks more into agency brokers.

“End users are getting used to technology where they have a full view of the market. They are accessing more markets than they could ever do 10 years ago,” says Chris Concannon, chief executive of Bats Global Markets.

At the same time, incidents like the Swiss move have also raised the alarm among banks. By the end of that day in January some smaller retail brokers faced ruin but even several larger broker-dealers such as Barclays, Citigroup and Deutsche Bank nursed tens of millions of dollars in losses. That has also left the market seeking as many different venues as possible where they can offset their customers’ trades.
“People are not holding risk like they were a year ago. A year ago they would warehouse that risk and wait for another customer to come along,” says Mr Concannon.

Not helping matters is how foreign exchange market liquidity is highly concentrated among just a handful of trading pairs, known as the G10. Into the gap on the other side of the trade are stepping high-frequency traders such as the US’s Virtu Financial. It is one of the world’s largest currency market makers.

“Clients that are trading on anonymous platforms by definition have no insight into whom they are trading with, and as such are likely interacting with non-bank liquidity providers more often than they know,” notes a report by Greenwich Associates last month.

However, even if the diagnosis is right, exchanges still face tough competition from well-established platforms not run by banks, such as Thomson Reuters, Bloomberg FXGO and ICAP’s EBS. These make up the majority of the $1.1tn average daily volume traded on electronic FX platforms and provide a role as a more centralised price benchmark independent of banks.

Bats, which has targeted London because it is the world’s main location for forex trading, will aim to provide a reliable venue for pricing and take more trading volume from the 220 banks, asset managers, hedge funds, dealers and retail brokers signed up to the venue.

Deutsche Börse sees 360T as a key part of its growth strategy, using it as a way to sell market data and develop futures, FX forwards and swaps trading to boost its Eurex derivatives business. But it is trading network, not an exchange-like central limit order book.

Critically, OTC markets are historically highly resistant to encroachment from exchanges and some see little sign of that changing.

The head of one currency trading platform says: “I don’t see any signs of moving to an exchange model. I don’t see a slam dunk here, I see some desperate buyers looking for a growth story.”

OTC FX trading becomes ‘exchange-like’

Thursday, April 21, 2016

The acquisition of trading platforms Hotspot and 360T by Bats Global Markets and Deutsche Börse respectively last year were bold statements of intent by exchange operators to grab a larger chunk of the trillions of dollars traded in FX every day.

FXSpotStream

However, while consolidation in the venues supporting FX trading can be expected to result in exchanges becoming more involved in the FX space, any actual market structure change is likely to take a long time to materialize, according to

FXSpotStream CEO Alan Schwarz.

“The FX market continues to do a good job of addressing regulatory requirements and meeting the demands of market participants,” he says.

“We have seen a shift in the FX market looking to trade more on a disclosed basis. Our business has continued to see year-on-year growth because there is a move taking place from exchange-like anonymous trading to bilateral, fully disclosed trading between counterparties.

“Unlike trading on an exchange, the relationship via FXSpotStream is transparent and trading with the liquidity providing banks is on a fully disclosed basis.”

Nuances

Kevin McPartland, head of market structure and technology research at Greenwich Associates, believes that discussion of migration from OTC to exchange fails to take account of some of the nuances of the FX market and that the future lies in venues that support multiple trading models.

“There are a host of non-exchange electronic trading venues that allow clients to trade with each other in a variety of ways,” he says.

Kevin McPartland,
Greenwich Associates

On the question of whether there is a discernible shift towards fully disclosed trading, McPartland refers to both central limit order book (CLOB) and request-for-quote (RFQ) having their merits.

Despite observations made by the likes of TeraExchange – that order book platforms offer a democratic marketplace through transparent, firm and executable prices – corporates have remained reluctant to abandon the RFQ model.

The key question for CLOB platform providers continues to be not why market participants have migrated to alternative models but rather when they will be in a position to win new business for products that are most suited for order books, such as the benchmarks and plain vanilla products.

“RGQ offers liquidity on demand and identification of counterparties, whereas CLOB is faster and its anonymity can be helpful,” says McPartland.

“But we are now seeing demand for a solution that provides the best of both worlds by enabling trading in an order book format while maintaining a bilateral relationship with counterparties.”

Regulation

According to James Sinclair, CEO of MarketFactory, options and other derivatives are moving closer to an exchange model due to the direct effects of regulation and the increased costs of compliance in OTC markets.

He refers to CME FX options as an example, noting they are effectively options on futures.

“However, the situation in the spot market is more complicated – some aspects are becoming closer to an exchange, others are moving further away,” he says. “FX has its own market structure that is hard to fit into the OTC/exchange paradigm.”

James Sinclair,
MarketFactory

One of the fundamental reasons why the market does not become centrally cleared, says Sinclair, is that a cleared model carries the cost of insurance against both settlement and market risk.

“CLS insures you against settlement risk but not the market risk,” he adds. “Counterparts still find it cheaper to self-insure against market risk in case of a counterparty default than to pay the extra cost of a fully cleared solution.”

A senior platform source observes that growth in exchange-traded products has largely come from futures traders who have looked for diversification and added FX as another asset class.

“Very little business has moved from OTC – some banks have added exchanges as additional liquidity sources to cover risk, but that is really the only business that has crossed the divide,” the source says.

OTC has become more exchange-like in that the largest banks have continued to extend their internalization of flow, so each now runs an order book trading structure internally.

However, our source also points out that the tightening of credit has reduced the number of prime brokers in FX and costs have risen “so the nearest thing that the FX OTC market has to centralized clearing has actually reduced its volume and capacity”, he concludes.


Evolution of Information Exchange in Trading Platforms

  • Clients C
  • Voice Broker VB
  • Dealers D
  • Electronic Broker EB
  • Prime Broker PB
  • Retail Aggregator – RA
  • Multi Bank Trading – MBT
  • Single Bank Trading – SBT


fx12


fxtradingplatforms_1


Top 10 FX Turnover Locations

  • United Kingdom – 37%
  • United States – 20%
  • Singapore – 7.9%
  • Hong Kong SAR – 6.7%
  • Japan – 6.1 %
  • France – 2.8%
  • Switzerland – 2.4%
  • Australia – 1.9%
  • Germany – 1.8%
  • Canada – 1.3%


fx13


FX Instruments

  • Spot
  • FX Swap
  • Outright Forward
  • Currency Swaps
  • FX Options


fx3


fx4

fx15


Currencies and Currency Pairs

US Dollar is the king in FX market.  87.6% of transactions include USD on one side of currency pair.  Euro comes at second with 31%.  Japanese Yen is at 21.6%.  UK Pound Sterling is at 12.8%.  Chinese Yuan has moved to 4%.

fx


Currencies and Currencies Pairs

fx2


Trends in FX Market

  • Electronic Trading
  • Algorithmic Trading
  • High Frequency Trading
  • Non Bank Liquidity Providers (Market Makers)


Non Bank Electronic Market Makers

The diverse set of non-bank electronic market-makers includes

  • XTX Markets
  • Virtu Financial
  • Citadel Securities
  • GTS
  • Jump Trading.

These market-makers’ trading volume is captured in the Triennial because their trades are prime-brokered by a dealer bank. They are active on multilateral trading platforms, where they provide prices to banks’ e-trading desks, retail aggregators, hedge funds and institutional clients.


Chinese RMB – in FX Markets

  • Second in Trade Finance
  • Sixth in Payments
  • Eighth in FX Trading


Considering China’s Renminbi for International Settlement and Forex Trading

On October 1, 2016, the International Monetary Fund added China’s renminbi1 (RMB) to its elite Special Drawing Right (SDR) basket of currencies, alongside the U.S. dollar, euro, yen and British pound. IMF said the change reflected China’s progress in reforming its monetary, foreign exchange and financial systems, and improving its financial market infrastructure.2 Short-term, this means countries can now include RMB assets in official FX reserves, making it easier for them to meet IMF guidelines.3 Beyond this, however, inclusion in SDR is a symbol of RMB’s emergence as an international currency for forex trading and settlement of global business transactions.

RMB’s ongoing progress is an important consideration for businesses involved in any FX trading, and particularly for those whose business or currency trading activities involve China.

RMB Usage Grows in Trade and Currency Trading

IMF’s decision arrives in the context of growing RMB usage in trade finance, international payments, and forex trading. In trade finance, RMB is now second amongst world currencies, reflecting enormous international trade with China.4

Since 2013, according to the Society for Worldwide Interbank Financial Telecommunication’s (SWIFT’s) monthly Renminbi Tracker, China’s currency has risen from ninth to fifth worldwide in total payments sent and received by value, not counting payments by central banks. During that period, it surpassed the Swedish Krona (SEK), Canadian Dollar (CAD), Swiss Franc (CHF), Australian Dollar (AUD) and, briefly during summer 2015, even the yen (JPY). RMB use is growing slowly in some markets (such as France, Switzerland and Germany), and is rapidly accelerating in others (e.g., the United Arab Emirates).5 SWIFT has elsewhere reported that 50 countries now use RMB for 10 percent or more of their trade with China.6

Meanwhile, according to the Bank for International Settlements’ (BIS’) September 2016 Central Bank Survey, RMB has doubled its share of OTC currency trading transactions since 2013. It has surpassed Mexico’s peso to become the most active developing market currency on forex trading exchanges, and is now eighth in FX trading amongst all currencies worldwide. BIS’s report notes that “as much as 95 percent of renminbi trading volume was against the U.S. dollar.”7

Building the Global Infrastructure for an Internationalized Currency

To promote RMB usage abroad, the People’s Bank of China (PBOC) – China’s central bank – has authorized 18 new official clearing banks worldwide since December 2012. These have opened in locations including Toronto, Buenos Aires, London, Paris, Johannesburg, Sydney, Seoul and Taipei.8 In September 2016, PBOC announced the first RMB clearing and settlement services in the U.S.9

Domestically, China has eliminated a cap on the number of enterprises permitted to carry out cross-border RMB settlements. Any company permitted to engage in import-export business may settle in RMB, unless it appears on a “black name list” (in which case its transactions may be reviewed individually).10 Restrictions have also been relaxed on RMB-denominated investments by foreigners.11

As Yu Yongding of the Asian Development Bank Institute has pointed out, China is the only country that has ever decided on its own to make internationalizing its currency a national priority.12 In determining how far RMB’s internationalization will go, China’s authorities appear to be balancing the benefits and risks of liberalization,13 carefully timing their decisions accordingly.

They face significant obstacles, not least the continuing downward pressure on the value of China’s currency on forex trading exchanges since it peaked against the U.S. dollar in early 2014. Some market observers believe RMB faces bank sector headwinds that might require a government bailout,14 as well as increased protectionist pressures in the U.S.15 and elsewhere. If these events lead to further reductions in RMB’s value, China could face accelerating capital flight,16 deepening internal opposition to the full elimination of capital controls.

Transacting in RMB

China’s reforms have made it easier for companies that do business in China to settle their transactions in RMB if they so desire. Many of their Chinese trading partners would welcome this, and some may even offer discounts if they can invoice in RMB.17 China’s central bank has estimated that transacting in U.S. dollars may add 2-to-3 percent in administrative expenses alone.18

The risk of currency fluctuation, however, remains a significant issue. Hedging vehicles exist; of course, these have their own costs. In making the decision about whether to transact business in RMB or another currency, companies may wish to make careful and timely assessments about currency risk.

The Takeaway

As China’s financial and market reforms move forward, RMB is emerging as a leading international currency. It has become far easier for international businesses and currency traders to transact in China’s home currency. International businesses may wish to carefully consider currency risk in developing their own plans for RMB forex trading and settlement.


Key Terms:

  • PB (Prime Brokerages)
  • Inter Dealer
  • Multi Dealer Trading
  • Single Dealer Trading
  • HFT (High Frequency Trading)
  • Market Makers
  • Liquidity Providers
  • Retail Aggregators
  • Retail FX Systems
  • Algorithmic Trading
  • FX ECNs (Electronic Communication Networks)
  • e-Trading
  • Hedge Funds
  • Institutional Clients
  • Non Bank Liquidity Providers
  • FXPB (Foreign Exchange Prime Brokerage)


Key Sources of Research:


Buttonwood The financial markets in an era of deglobalisation

Why the global volume of foreign-exchange trading is shrinking

Dec 15th 2016

http://www.economist.com/news/finance-and-economics/21711887-why-global-volume-foreign-exchange-trading-shrinking-financial?zid=295&ah=0bca374e65f2354d553956ea65f756e0


Downsized FX markets: causes and implications

BIS

Click to access r_qt1612.pdf


Triennial Central Bank Survey Foreign exchange turnover in April 2016


Click to access rpfx16fx.pdf


TheForeign Exchange andInterest Rate Derivatives Markets:Turnover in the United States, April 2016

Click to access 2016triennialreport.pdf


The foreign exchange and over-the-counter interest rate derivatives market in the United Kingdom 

Quarterly Bulletin 2016 Q4
16 December 2016

By Alexander Hutton and Edward Kent

http://www.bankofengland.co.uk/publications/Pages/quarterlybulletin/2016/q4/a6.aspx


The anatomy of the global FX market through the lens of the 2013 Triennial Survey

Click to access r_qt1312e.pdf


The foreign exchange and over-the-counter interest rate derivatives market in the United Kingdom

2013


Click to access qb130410.pdf


The $4 trillion question: what explains FX growth since the 2007 survey?

Click to access r_qt1012e.pdf


CME Group OTC FX Clearing


Click to access otc-fx-clearing.pdf


CME Group Cleared OTC Financial Products


Click to access cleared-otc-financial-products.pdf


Citi tops Euromoney global FX poll again, but big banks lose grip

http://www.reuters.com/article/global-forex-euromoney-idUSL5N18M29O


Foreign Exchange Market

https://en.wikipedia.org/wiki/Foreign_exchange_market


All change in the 2016 Euromoney FX rankings

http://www.euromoney.com/Article/3556871/All-change-in-the-2016-Euromoney-FX-rankings.html?single=true


World’s Best FX Providers 2017

Automation, “algo trading” and a tighter regulatory environment are driving change in the industry

https://www.gfmag.com/topics/blogs/it-pays-have-good-forex-bank


360T

http://www.360t.com/about-us/press/


CBOE Will Acquire BATS Global Markets for $3.2 Billion

http://fortune.com/2016/09/26/cboe-acquires-bats/


e-FOREX

http://www.e-forex.net/institutional-fx-ecommerce.html


Providing Differentiated Service in an Ever-Evolving Market

2016 Greenwich Leaders: Global Foreign Exchange Services

https://www.greenwich.com/fixed-income-fx-cmds/providing-differentiated-service-ever-evolving-market


Press Release: Best FX Awards 2017 – Providers and Corporate

https://www.gfmag.com/media/press-releases/best-fx-awards-2017-providers-and-corporate


Global Finance Names The World’s Best Foreign Exchange Providers 2016

https://www.gfmag.com/media/press-releases/global-finance-names-worlds-best-foreign-exchange-providers-2016


Global Banking & Finance Review Awards – 2015

https://www.globalbankingandfinance.com/global-banking-finance-review-awards-2015/


New Electronic Trading Systems in Foreign Exchange Markets

2003

D Rime

Click to access Rime-1.pdf


Click to access Rime%20New%20Electronic%20FX1.pdf


Foreign exchange market structure, players and evolution

Michael R. King, Carol Osler and Dagfinn Rime

2011

Click to access Rime-2.pdf


Settlement Risk in the Global FX Market: How Much Remains?

8 Nov 2016

Dino Kos

Richard M. Levich

https://papers.ssrn.com/sol3/papers2.cfm?abstract_id=2827530


The Retail Spot Foreign Exchange Market Structure and Participants
John H. Forman III

March 22, 2016

https://papers.ssrn.com/sol3/papers2.cfm?abstract_id=2753823


Algorithmic trading in the foreign exchange market

Maria Bergsten and Johannes Forss sandahl

2013


Click to access rap_pov_artikel_2_130321_eng.pdf


The Future of the Foreign Exchange Market

Richard K. Lyons


Click to access Lyons%20Brookings.pdf


Multi Bank Platforms

http://www.londonfx.co.uk/ecn.html


ECNs/Alternative Trading Systems

https://www.sec.gov/divisions/marketreg/mrecn.shtml


The Transition to Electronic Communications Networks in the Secondary Treasury Market

Bruce Mizrach and Christopher J. Neely


http://citeseerx.ist.psu.edu/viewdoc/download?doi=10.1.1.205.6479&rep=rep1&type=pdf


Deal or no deal: anatomy of an FX portal

http://treasurytoday.com/2013/06/deal-or-no-deal-anatomy-of-an-fx-portal


The 3 Pillars of Forex

http://www.zerohedge.com/news/2016-06-11/3-pillars-forex


THE VALUE OF APAMA

IN FAST-CHANGING FX MARKETS


Click to access sec_SAG_Apama_In-Fast-Changing-FX-Markets_4PG_WP_Feb16_tcm16-116205.pdf


The Global Foreign Exchange Market: Growth and Transformation


William Barker


Click to access barker.pdf


FX ALL

http://www.fxall.com


Currenex

https://www.currenex.com


Most Innovative Bank e-FX Trading Platform: Citi

http://www.fxweek.com/fx-week/interview/2464092/most-innovative-bank-e-fx-trading-platform-citi#


Citi sells its electronic FX platform

https://ftalphaville.ft.com/2010/01/04/118946/citi-sells-its-electronic-fx-platform/


Nasdaq poised to launch FX trading platform: top executive

http://www.reuters.com/article/us-nasdaq-forex-idUSKCN0QT1VD20150824


State Street buys electronic foreign exchange trading platform Currenex

http://www.thetradenews.com/Asset-Classes/Foreign-exchange/State-Street-buys-electronic-foreign-exchange-trading-platform-Currenex/


EBS

http://www.ebs.com


Electronic Platforms in Foreign Exchange Trading

http://celent.com/reports/electronic-platforms-foreign-exchange-trading


HOTSPOT FX

https://www.hotspotfx.com


Icap’s EBS BrokerTec Inks Deal With China’s CFETS

http://www.waterstechnology.com/sell-side-technology/news/2460560/icaps-ebs-brokertec-inks-deal-with-chinas-cfets


Best Single-Dealer FX Trading Platform

https://www.fnlondon.com/articles/fn-trading-and-technology-awards-shortlist-2015-best-single-dealer-fx-trading-platform-20150810


Multi-Dealer Platforms to gain ground in 2015

http://www.e-forex.net/articles/apr-2015-multidealer-platforms-to-gain-ground-in-2015.html


PERSPECTIVE ON NEW ELECTRONIC PLATFORMS, FROM EXECUTION TO DISTRIBUTION

http://fintank.net/position_papers/electronic_platforms/


FX Trading Platforms: Models Converge and Competition Heats Up

http://celent.com/reports/fx-trading-platforms-models-converge-and-competition-heats


Trends in Foreign Exchange Markets and the Challenges Ahead

https://www.newyorkfed.org/newsevents/speeches/2015/pot150714


Restoring trust in global FX markets

Click to access restoring-trust-report.pdf


2016 – Entering the Age of the “Non-Bank”

http://www.financemagnates.com/thought-leadership/prime-of-prime/2016-entering-the-age-of-the-non-bank/


The New Wall Street: Even Big Banks Want Help Navigating Markets

Matthew Leising and Annie Massa

Aug 10, 2016

http://www.wealthmanagement.com/markets/new-wall-street-even-big-banks-want-help-navigating-markets


The Future of Computer Trading in Financial Markets

An International Perspective


Click to access tacfuturecomputertrading1012.pdf


Small Fish Big Prize:  Market Makers out to eat Bank’s lunch

Click to access Small-fish-big-prize-The-Market-makers-out-to-eat-the-banks.pdf


Automated Trading in Treasury Markets


Click to access TMPG%20HFT%20White%20Paper%20FINAL%20-%202015-04-08.pdf


High Frequency Traders Elbow Their Way Into the Currency Markets

by Lananh Nguyen

September 12, 2016

https://www.bloomberg.com/news/articles/2016-09-12/fastest-guys-in-stocks-are-becoming-a-force-in-currency-markets


Exclusive: U.S. investigates market-making operations of Citadel, KCG

http://www.reuters.com/article/us-usa-stocks-probe-exclusive-idUSKCN0Y11CJ


Considering China’s Renminbi for International Settlement and Forex Trading

By Bill Camarda

https://www.americanexpress.com/us/content/foreign-exchange/articles/renminbi-for-forex-trading/


Pound plummet blamed on ‘liquidity holes’

Sterling’s flash crash was triggered during Asian ‘graveyard shift’ when US/European traders away

https://www.ft.com/content/dc7c0846-8e00-11e6-a72e-b428cb934b78


Settlement risk in foreign exchange markets and CLS Bank

Click to access r_qt0212f.pdf


CLS Bank

https://www.cls-group.com/Pages/default.aspx