Increasung Market Concentration – Update October 2020
In this post I have compiled several newly published papers books and articles on the subject of Increasing market concentration. Mainly in 2019 and 2020.
Competition, Concentration, and Anti-Trust Laws in the USA
Currently the US FTC has been having hearings on concentration, competition, and anti-trust laws in the USA. Several conferences are organized starting with September 2018. I present links to hearings details and videos of the sessions. As of now, two hearings have already taken place. I have given the links to the third hearing below. Economists Joe Stiglitz and Jason Furman have given speeches and presentations during first and second hearings.
Key Sources of Research:
Hearings on Competition and Consumer Protection in the 21st Century
The Federal Trade Commission will hold a series of public hearings during the fall and winter 2018 examining whether broad-based changes in the economy, evolving business practices, new technologies, or international developments might require adjustments to competition and consumer protection law, enforcement priorities, and policy. The PDF version of this content includes footnotes and sources. All the hearings will be webcast live.
Recent Economic Policy Symposium at Jackson Hole Wyoming (August 23-25) where economists, central bankers, policy makers gather together annually discussed issues of Rising Market Concentration, Declining Business Investments, and Declining Economic Dynamism.
2018 Economic Policy Symposium, Jackson Hole, Wyoming
OECD held a joint conference with the World Bank and the IMF on Product Market Concentration, Inclusive Growth, and Regulation at OECD HQ, Paris, France. 11 June, 2018.
Public traded companies are always under pressure to show earnings growth and sales revenue growth to enhance shareholder value.
How do they do it when markets have matured and economy has slowed?
Lower Costs
Increase Market Share
Find New Markets
Diversify
Create New products and services
How do then companies lower their costs?
Vertical Mergers and Acquisitions
Outsourcing (Sourcing parts and components / Intermediate Goods / Inputs from cross border)
Offshoring (Shifting Production cross border)
Vertical Integration
How do then companies increase their market share?
Horizontal Mergers and Acquisitions
Cross Border Markets Share (Sales in other countries)
In the last thirty years, this is exactly what has happened in US economy.
Macro Trends of increase in Outsourcing/Offshoring, Increase in Market Concentration, Increase in Inequality, Increase in Corporate Profits, Rising Equity Prices, Slower Productivity Growth, Lower Interest Rates, Low Labor Share, and Capital Share.
Please see my other posts expanding on these issues.
Please note that these forces are continuing and trends will remain on current trajectory.
Key Terms:
Stakeholder vs Shareholder Capitalism
Short Termism
Slow Productivity Growth
Rising Market Concentration
Rising Profits
Rising Equities Market
Rising Inequality
Dupont Ratio Analysis
Financial Planning (Micro – Firm Level)
Economic Planning (Macro- Aggregate Level)
Quarterly Capitalism
From SHAREHOLDER CAPITALISM: A SYSTEM IN CRISIS
Our current, highly financialised, form of shareholder capitalism is not just failing to provide new capital for investment, it is actively undermining the ability of listed companies to reinvest their own profits. The stock market has become a vehicle for extracting value from companies, not for injecting it.
No wonder that Andy Haldane, Chief Economist of the Bank of England, recently suggested that shareholder capitalism is ‘eating itself.’1 Corporate governance has become dominated by the need to maximise short-term shareholder returns. At the same time, financial markets have grown more complex, highly intermediated, and similarly shorttermist, with shares increasingly seen as paper assets to be traded rather than long term investments in sound businesses.
This kind of trading is a zero-sum game with no new wealth, let alone social value, created. For one person to win, another must lose – and increasingly, the only real winners appear to be the army of financial intermediaries who control and perpetuate the merry-goround. There is nothing natural or inevitable about the shareholder-owned corporation as it currently exists. Like all economic institutions, it is a product of political and economic choices which can and should be remade if they no longer serve our economy, society, or environment.
Here’s the impact this shareholder model is currently having:
• Economy: Shareholder capitalism is holding back productive investment. Even the Chief Executive of BlackRock, the world’s largest asset manager, has admitted that pressure to keep the share price high means corporate leaders are ‘underinvesting in innovation, skilled workforces or essential capital expenditures.’ 2
• Society: Shareholder capitalism is driving inequality. There is growing evidence that attempts to align executive pay with shareholder value are largely responsible for the ballooning of salaries at the top. The prioritisation of shareholder interests has also contributed to a dramatic decline in UK wages relative to profits, helping to explain the failure of ordinary people’s living standards to rise in line with economic growth.
• Environment: Shareholder capitalism helps to drive environmental destruction. It does this by driving risky shortterm behaviour, such as fossil fuel extraction, which ignores long-term environmental risks.
The idea that shareholder capitalism is the most efficient way to mobilise large amounts of capital is no longer tenable.
We need both to create new models of companies, and implement new ways of organising investment that are fit for building an inclusive, equal, and sustainable economy.
Companies should be explicitly accountable to a mission and a set of interests beyond shareholder returns. Equally, investment must provide long-term capital for socially and environmentally useful projects, and damaging forms of speculation must be restricted.
For most people, our economy simply is not working, and the damaging aspects of shareholder capitalism are at least in part responsible. Reforming shareholder capitalism must not be dismissed as too difficult – the crisis is too urgent for that. We can take the first steps towards a better economic model right now. It’s time to act.
A Crash Course in Dupont Financial Ratio Analysis
What happens when economic growth slows ?
What happens when profit margins decline ?
What happens when Sales growth is limited ?
What does lead to Mergers and Acquisitions ?
What is the impact of Cost of Capital ?
What is EVA (Economic Value Added) ?
What is impact of Outsourcing/Offshoring on Financial Ratios ?
What is impact of Mergers and Acquisitions on Financial Ratios ?
What is impact of Stock Buy Backs on Financial Ratios ?
What is impact of Dividends on Financial Ratios ?
ROS (Return on Sales)
ROE (Return on Equities)
ROA (Return on Assets)
ROIC (Return on Invested Capital)
EVA (Economic Value Added)
MVA (Market Value Added)
From The DuPont Equation, ROE, ROA, and Growth
The DuPont Equation
The DuPont equation is an expression which breaks return on equity down into three parts: profit margin, asset turnover, and leverage.
Learning Objectives
Explain why splitting the return on equity calculation into its component parts may be helpful to an analyst
Key Takeaways
Key Points
By splitting ROE into three parts, companies can more easily understand changes in their returns on equity over time.
As profit margin increases, every sale will bring more money to a company’s bottom line, resulting in a higher overall return on equity.
As asset turnover increases, a company will generate more sales per asset owned, resulting in a higher overall return on equity.
Increased financial leverage will also lead to an increase in return on equity, since using more debt financing brings on higher interest payments, which are tax deductible.
Key Terms
competitive advantage: something that places a company or a person above the competition
The DuPont Equation
DuPont Model: A flow chart representation of the DuPont Model.
The DuPont equation is an expression which breaks return on equity down into three parts. The name comes from the DuPont Corporation, which created and implemented this formula into their business operations in the 1920s. This formula is known by many other names, including DuPont analysis, DuPont identity, the DuPont model, the DuPont method, or the strategic profit model.
The DuPont Equation: In the DuPont equation, ROE is equal to profit margin multiplied by asset turnover multiplied by financial leverage.
Under DuPont analysis, return on equity is equal to the profit margin multiplied by asset turnover multiplied by financial leverage. By splitting ROE (return on equity) into three parts, companies can more easily understand changes in their ROE over time.
Components of the DuPont Equation: Profit Margin
Profit margin is a measure of profitability. It is an indicator of a company’s pricing strategies and how well the company controls costs. Profit margin is calculated by finding the net profit as a percentage of the total revenue. As one feature of the DuPont equation, if the profit margin of a company increases, every sale will bring more money to a company’s bottom line, resulting in a higher overall return on equity.
Components of the DuPont Equation: Asset Turnover
Asset turnover is a financial ratio that measures how efficiently a company uses its assets to generate sales revenue or sales income for the company. Companies with low profit margins tend to have high asset turnover, while those with high profit margins tend to have low asset turnover. Similar to profit margin, if asset turnover increases, a company will generate more sales per asset owned, once again resulting in a higher overall return on equity.
Components of the DuPont Equation: Financial Leverage
Financial leverage refers to the amount of debt that a company utilizes to finance its operations, as compared with the amount of equity that the company utilizes. As was the case with asset turnover and profit margin, Increased financial leverage will also lead to an increase in return on equity. This is because the increased use of debt as financing will cause a company to have higher interest payments, which are tax deductible. Because dividend payments are not tax deductible, maintaining a high proportion of debt in a company’s capital structure leads to a higher return on equity.
The DuPont Equation in Relation to Industries
The DuPont equation is less useful for some industries, that do not use certain concepts or for which the concepts are less meaningful. On the other hand, some industries may rely on a single factor of the DuPont equation more than others. Thus, the equation allows analysts to determine which of the factors is dominant in relation to a company’s return on equity. For example, certain types of high turnover industries, such as retail stores, may have very low profit margins on sales and relatively low financial leverage. In industries such as these, the measure of asset turnover is much more important.
High margin industries, on the other hand, such as fashion, may derive a substantial portion of their competitive advantage from selling at a higher margin. For high end fashion and other luxury brands, increasing sales without sacrificing margin may be critical. Finally, some industries, such as those in the financial sector, chiefly rely on high leverage to generate an acceptable return on equity. While a high level of leverage could be seen as too risky from some perspectives, DuPont analysis enables third parties to compare that leverage with other financial elements that can determine a company’s return on equity.
ROE and Potential Limitations
Return on equity measures the rate of return on the ownership interest of a business and is irrelevant if earnings are not reinvested or distributed.
Learning Objectives
Calculate a company’s return on equity
Key Takeaways
Key Points
Return on equity is an indication of how well a company uses investment funds to generate earnings growth.
Returns on equity between 15% and 20% are generally considered to be acceptable.
Return on equity is equal to net income (after preferred stock dividends but before common stock dividends) divided by total shareholder equity (excluding preferred shares ).
Stock prices are most strongly determined by earnings per share (EPS) as opposed to return on equity.
Key Terms
fundamental analysis: An analysis of a business with the goal of financial projections in terms of income statement, financial statements and health, management and competitive advantages, and competitors and markets.
Return On Equity
Return on equity (ROE) measures the rate of return on the ownership interest or shareholders’ equity of the common stock owners. It is a measure of a company’s efficiency at generating profits using the shareholders’ stake of equity in the business. In other words, return on equity is an indication of how well a company uses investment funds to generate earnings growth. It is also commonly used as a target for executive compensation, since ratios such as ROE tend to give management an incentive to perform better. Returns on equity between 15% and 20% are generally considered to be acceptable.
The Formula
Return on equity is equal to net income, after preferred stock dividends but before common stock dividends, divided by total shareholder equity and excluding preferred shares.
Return On Equity: ROE is equal to after-tax net income divided by total shareholder equity.
Expressed as a percentage, return on equity is best used to compare companies in the same industry. The decomposition of return on equity into its various factors presents various ratios useful to companies in fundamental analysis.
ROE Broken Down: This is an expression of return on equity decomposed into its various factors.
The practice of decomposing return on equity is sometimes referred to as the “DuPont System. ”
Potential Limitations of ROE
Just because a high return on equity is calculated does not mean that a company will see immediate benefits. Stock prices are most strongly determined by earnings per share (EPS) as opposed to return on equity. Earnings per share is the amount of earnings per each outstanding share of a company’s stock. EPS is equal to profit divided by the weighted average of common shares.
Earnings Per Share: EPS is equal to profit divided by the weighted average of common shares.
The true benefit of a high return on equity comes from a company’s earnings being reinvested into the business or distributed as a dividend. In fact, return on equity is presumably irrelevant if earnings are not reinvested or distributed.
Assessing Internal Growth and Sustainability
Sustainable– as opposed to internal– growth gives a company a better idea of its growth rate while keeping in line with financial policy.
Learning Objectives
Calculate a company’s internal growth and sustainability ratios
Key Takeaways
Key Points
The internal growth rate is a formula for calculating the maximum growth rate a firm can achieve without resorting to external financing.
Sustainable growth is defined as the annual percentage of increase in sales that is consistent with a defined financial policy.
Another measure of growth, the optimal growth rate, assesses sustainable growth from a total shareholder return creation and profitability perspective, independent of a given financial strategy.
Key Terms
retention: The act of retaining; something retained
retention ratio: retained earnings divided by net income
sustainable growth rate: the optimal growth from a financial perspective assuming a given strategy with clear defined financial frame conditions/ limitations
Internal Growth and Sustainability
The true benefit of a high return on equity arises when retained earnings are reinvested into the company’s operations. Such reinvestment should, in turn, lead to a high rate of growth for the company. The internal growth rate is a formula for calculating maximum growth rate that a firm can achieve without resorting to external financing. It’s essentially the growth that a firm can supply by reinvesting its earnings. This can be described as (retained earnings)/(total assets ), or conceptually as the total amount of internal capital available compared to the current size of the organization.
We find the internal growth rate by dividing net income by the amount of total assets (or finding return on assets ) and subtracting the rate of earnings retention. However, growth is not necessarily favorable. Expansion may strain managers’ capacity to monitor and handle the company’s operations. Therefore, a more commonly used measure is the sustainable growth rate.
Sustainable growth is defined as the annual percentage of increase in sales that is consistent with a defined financial policy, such as target debt to equity ratio, target dividend payout ratio, target profit margin, or target ratio of total assets to net sales.
We find the sustainable growth rate by dividing net income by shareholder equity (or finding return on equity) and subtracting the rate of earnings retention. While the internal growth rate assumes no financing, the sustainable growth rate assumes you will make some use of outside financing that will be consistent with whatever financial policy being followed. In fact, in order to achieve a higher growth rate, the company would have to invest more equity capital, increase its financial leverage, or increase the target profit margin.
Optimal Growth Rate
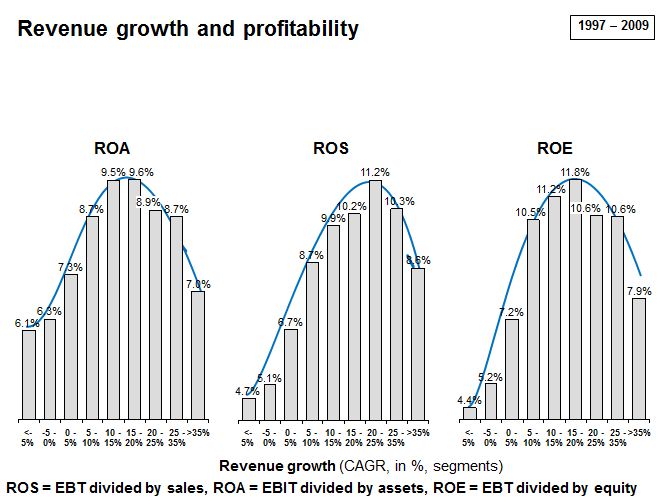
Another measure of growth, the optimal growth rate, assesses sustainable growth from a total shareholder return creation and profitability perspective, independent of a given financial strategy. The concept of optimal growth rate was originally studied by Martin Handschuh, Hannes Lösch, and Björn Heyden. Their study was based on assessments on the performance of more than 3,500 stock-listed companies with an initial revenue of greater than 250 million Euro globally, across industries, over a period of 12 years from 1997 to 2009.
Revenue Growth and Profitability: ROA, ROS and ROE tend to rise with revenue growth to a certain extent.
Due to the span of time included in the study, the authors considered their findings to be, for the most part, independent of specific economic cycles. The study found that return on assets, return on sales and return on equity do in fact rise with increasing revenue growth of between 10% to 25%, and then fall with further increasing revenue growth rates. Furthermore, the authors attributed this profitability increase to the following facts:
Companies with substantial profitability have the opportunity to invest more in additional growth, and
Substantial growth may be a driver for additional profitability, whether by attracting high performing young professionals, providing motivation for current employees, attracting better business partners, or simply leading to more self-confidence.
However, according to the study, growth rates beyond the “profitability maximum” rate could bring about circumstances that reduce overall profitability because of the efforts necessary to handle additional growth (i.e., integrating new staff, controlling quality, etc).
Dividend Payments and Earnings Retention
The dividend payout and retention ratios offer insight into how much of a firm’s profit is distributed to shareholders versus retained.
Learning Objectives
Calculate a company’s dividend payout and retention ratios
Key Takeaways
Key Points
Many corporations retain a portion of their earnings and pay the remainder as a dividend.
Dividends are usually paid in the form of cash, store credits, or shares in the company.
Cash dividends are a form of investment income and are usually taxable to the recipient in the year that they are paid.
Dividend payout ratio is the fraction of net income a firm pays to its stockholders in dividends.
Retained earnings can be expressed in the retention ratio.
Key Terms
stock split: To issue a higher number of new shares to replace old shares. This effectively increases the number of shares outstanding without changing the market capitalization of the company.
Dividend Payments and Earnings Retention
Dividends are payments made by a corporation to its shareholder members. It is the portion of corporate profits paid out to stockholders. On the other hand, retained earnings refers to the portion of net income which is retained by the corporation rather than distributed to its owners as dividends. Similarly, if the corporation takes a loss, then that loss is retained and called variously retained losses, accumulated losses or accumulated deficit. Retained earnings and losses are cumulative from year to year with losses offsetting earnings. Many corporations retain a portion of their earnings and pay the remainder as a dividend.
A dividend is allocated as a fixed amount per share. Therefore, a shareholder receives a dividend in proportion to their shareholding. Retained earnings are shown in the shareholder equity section in the company’s balance sheet –the same as its issued share capital.
Public companies usually pay dividends on a fixed schedule, but may declare a dividend at any time, sometimes called a “special dividend” to distinguish it from the fixed schedule dividends. Dividends are usually paid in the form of cash, store credits (common among retail consumers’ cooperatives), or shares in the company (either newly created shares or existing shares bought in the market). Further, many public companies offer dividend reinvestment plans, which automatically use the cash dividend to purchase additional shares for the shareholder.
Cash dividends (most common) are those paid out in currency, usually via electronic funds transfer or a printed paper check. Such dividends are a form of investment income and are usually taxable to the recipient in the year they are paid. This is the most common method of sharing corporate profits with the shareholders of the company. For each share owned, a declared amount of money is distributed. Thus, if a person owns 100 shares and the cash dividend is $0.50 per share, the holder of the stock will be paid $50. Dividends paid are not classified as an expense but rather a deduction of retained earnings. Dividends paid do not show up on an income statement but do appear on the balance sheet.
Example Balance Sheet: Retained earnings can be found on the balance sheet, under the owners’ (or shareholders’) equity section.
Stock dividends are those paid out in the form of additional stock shares of the issuing corporation or another corporation (such as its subsidiary corporation). They are usually issued in proportion to shares owned (for example, for every 100 shares of stock owned, a 5% stock dividend will yield five extra shares). If the payment involves the issue of new shares, it is similar to a stock split in that it increases the total number of shares while lowering the price of each share without changing the market capitalization, or total value, of the shares held.
Dividend Payout and Retention Ratios
Dividend payout ratio is the fraction of net income a firm pays to its stockholders in dividends:
The part of the earnings not paid to investors is left for investment to provide for future earnings growth. These retained earnings can be expressed in the retention ratio. Retention ratio can be found by subtracting the dividend payout ratio from one, or by dividing retained earnings by net income.
Dividend Payout Ratio: The dividend payout ratio is equal to dividend payments divided by net income for the same period.
Relationships between ROA, ROE, and Growth
Return on assets is a component of return on equity, both of which can be used to calculate a company’s rate of growth.
Learning Objectives
Discuss the different uses of the Return on Assets and Return on Assets ratios
Key Takeaways
Key Points
Return on equity measures the rate of return on the shareholders ‘ equity of common stockholders.
Return on assets shows how profitable a company’s assets are in generating revenue.
In other words, return on assets makes up two-thirds of the DuPont equation measuring return on equity.
Capital intensity is the term for the amount of fixed or real capital present in relation to other factors of production. Rising capital intensity pushes up the productivity of labor.
Key Terms
return on common stockholders’ equity: a fiscal year’s net income (after preferred stock dividends but before common stock dividends) divided by total equity (excluding preferred shares), expressed as a percentage
quantitatively: With respect to quantity rather than quality.
Return On Assets Versus Return On Equity
In review, return on equity measures the rate of return on the ownership interest (shareholders’ equity) of common stockholders. Therefore, it shows how well a company uses investment funds to generate earnings growth. Return on assets shows how profitable a company’s assets are in generating revenue. Return on assets is equal to net income divided by total assets.
Return On Assets: Return on assets is equal to net income divided by total assets.
This percentage shows what the company can do with what it has (i.e., how many dollars of earnings they derive from each dollar of assets they control). This is in contrast to return on equity, which measures a firm’s efficiency at generating profits from every unit of shareholders’ equity. Return on assets is, however, a vital component of return on equity, being an indicator of how profitable a company is before leverage is considered. In other words, return on assets makes up two-thirds of the DuPont equation measuring return on equity.
ROA, ROE, and Growth
In terms of growth rates, we use the value known as return on assets to determine a company’s internal growth rate. This is the maximum growth rate a firm can achieve without resorting to external financing. We use the value for return on equity, however, in determining a company’s sustainable growth rate, which is the maximum growth rate a firm can achieve without issuing new equity or changing its debt-to-equity ratio.
Capital Intensity and Growth
Return on assets gives us an indication of the capital intensity of the company. “Capital intensity” is the term for the amount of fixed or real capital present in relation to other factors of production, especially labor. The underlying concept here is how much output can be procured from a given input (assets!). The formula for capital intensity is below:
Capital Intensity=Total AssetsSales
The use of tools and machinery makes labor more effective, so rising capital intensity pushes up the productivity of labor. While companies that require large initial investments will generally have lower return on assets, it is possible that increased productivity will provide a higher growth rate for the company. Capital intensity can be stated quantitatively as the ratio of the total money value of capital equipment to the total potential output. However, when we adjust capital intensity for real market situations, such as the discounting of future cash flows, we find that it is not independent of the distribution of income. In other words, changes in the retention or dividend payout ratios can lead to changes in measured capital intensity.
This document was prepared by the OECD Secretariat to serve as an issues paper for the hearing on market concentration taking place at the 129th meeting of the OECD Competition Committee on 6-8 June 2018
Rising Market Concentration and Declining Business Investments in the USA – Update June 2018
Since my last posts in August/September 2017 on the subject of
Market Concentration
Inequality
Market Power
Reduced Competition
Reduced Dynamism
Rising Profits
Declining Business Investments
several new studies have been published. In addition, several important hearings and conferences have been organized by OECD, Brookings Institution, Boston University School of Law. Please see my list of references for details of each one of them.
This topic now is getting good attention in media also.
The Peterson Institute for International Economics (PIIE) held a major research conference on the “Policy Implications of Sustained Low Productivity Growth” on November 9, 2017. Jeromin Zettelmeyer, PIIE, moderates panel 4, “Wages and Inequality.” Presenters include Jason Furman, Harvard University and PIIE, and Lawrence H. Summers, Harvard University. I have given the link to Video of the session 4 in the references.
OECD on June 7-8, 2018 held hearings on Market Concentration at Paris, France. Several presentations were given by experts in the field. I have given link to the conference webpage in the references.
The Hamilton Project/Brookings Institution had a Conference on June 13, 2018 in Washington DC on the subject of Market Concentration. Please see the link to the conference video and papers in the references below.
From The State of Competition and Dynamism: Facts about Concentration, Start-Ups, and Related Policies
From The State of Competition and Dynamism: Facts about Concentration, Start-Ups, and Related Policies
The possible connection between inequality and market concentration, however, has been relatively understudied for many years—until recent years, that is, when a sheafof new studies examining the interactions between concentration, market power, and inequality began to appear.
A 2015 paper by Jonathan Baker and Steven Salop, for instance, examined the connection between inequality and market power and argued that “because the creation and exercise of market power tend to raise the return to capital, market power contributes to the development and perpetuation of inequality.” Harvard Law School’s Einer Elhauge also found that horizontal shareholding likely leads to anti-competitive price raises and has regressive effects. Daniel Crane of the University of Michigan, however, contends that the connection between antitrust and wealth inequality has been grossly oversimplified by advocates of tougher antitrust enforcement.
Asked if there was a connection between concentration and inequality, Chicago Booth professors Austan Goolsbee, Steven Kaplan, and Sam Peltzman pointed to data being inconclusive. Goolsbee said: “Probably [there is a connection]. But we don’treally know more than correlations at this point.” Kaplan said his own research “suggests that winner-take-all markets (driven by technology and scale) play a rolein inequality. However, they may not play the most important role.” And Peltzmansaid that “The timing suggests so, but there are a lot of unconnected dots in this question.”
Is rising inequality connected to monopolies, rent-seeking, and concentration, or is it a result of larger forces like globalization and technology? Can antitrust be used effectively to mitigate inequality, or is concentration a sign of greater efficiency? These questions, and others, were debated by economists and legal scholars during a panel at the recent Stigler Center conference on concentration in America.
The panel featured Peter Orszag, Vice Chairman and Managing Director of the financial advisory and asset management firm Lazard Freres; Justin Pierce, a Senior Economist at the Board of Governors of the Federal Reserve; Lina Khan, a fellow at Open Markets program at New America; Sabeel Rahman, an Assistant Professor of Law at Brooklyn Law School; Simcha Barkai, a PhD Candidate at the University of Chicago Booth School of Business; and German Gutierrez, a PhD Candidate at the New York University Stern School of Business. The panel was moderated by Matt Stoller of the Open Markets program at New America, who opened by observing that “a new kind of Brandeis School of antitrust is emerging, in terms of thinking about political economy.”
Much of the panel focused on the dramatic rise in corporate profits. A recent, much-discussed Stigler Center working paper by Simcha Barkai found that over the past 30 years, as labor’s share of output fell by 10 percent, the capital share declined even further. This finding goes against the argument that the labor share went down due to technological changes, or as Barkai put it: “We used to spend money on people, today we’re spending money on robots.”
Barkai’s paper finds no evidence to support the technological argument. “We’re spending less on all inputs. If you think of this from the perspective of a firm, this is terrific. After accounting for all of my costs—material inputs, workers, capital—I am left with a large amount of money, much more so than in the past.” What Barkai does find, however, is that profits have gone way up. From 1984 to 2014, the profit share increased from 2.5 percent of GDP to 15 percent.
“To give you a sense of how large these profits are, if you look over the past 30 years and you ask, ‘How much have profits increased?’ you can give a number in dollars. A better way to think about that is, “Per worker, how much have these dollars increased?” It’s about $14,000 per worker. That’s a really large number because, in 2014, personal median income was just over $28,000. It’s about half of personal median income,” said Barkai.
Barkai went on to say that these findings were more pronounced in industries that experienced an increase in concentration. “Those industries that have a large increase in concentration also have larger declines in the labor share,” he said. Barkai’s conclusions were echoed by a separate study that was recently published by David Autor, David Dorn, Lawrence Katz, Christina Patterson, and John Van Reenen, in which they found that higher concentration is connected to the fall in the labor share.
One way to consider the question of concentration and inequality, said Pierce, is to look at what happens to firms’ efficiency and markups as a result of a merger. In a recent paper with Bruce Blonigen, Pierce was able to utilize new techniques in order to isolate the effects of mergers in the manufacturing sector. Comparing data from factories that were acquired during mergers to similar factories that weren’t, and to factories where an acquisition has been announced but not yet completed, Pierce and Blonigen found no evidence of the standard argument that mergers benefit consumers by increasing efficiency, reducing production costs, and, in turn, lowering prices. Quite the opposite: they found evidence that mergers increase market power, allowing firms to generate higher profits by raising prices.
“What we find when we do this is that mergers on average are associated with increases in markups in a magnitude of 15 to 50 percent. When we look at the effect on productivity, we actually don’t find a statistically significant effect on productivity associated with mergers,” said Pierce.
Gutierrez, meanwhile, spoke about his 2016 paper with Thomas Philippon, in which the two found that concentrated industries with less entry and more concentration invest less. Before 2000, he explained, firms funneled about 20 cents of every dollar of surplus into investments. Since 2000, however, investments dropped by half—to 10 cents on the dollar.
Their findings, he said, rule out the argument that the drop in investments is related to control by the stock market. The data also rule out other theories, such as financial constraints, safety premiums, or globalization. “What we’re left with is competition, or lack of competition and governance,” said Gutierrez.
“What we find is that most industries have become more concentrated. That leads to a decrease in investment. It means less investment by leaders in particular, and at the industry as a whole. Some manufacturing industries have seen increased competition from China. For the U.S. in particular, we see that leaders invest more. They try and hold onto their position, but the overall effect is somewhat negative on aggregate investment in the U.S.”
How is this drop in investments connected to an increase in concentration? Gutierrez offered two hypotheses: one, that superstar firms, such as digital platforms, are more productive and are therefore capturing more market share. The second, he said, is increased regulation: “In particular, if you look at the cross section of industries, industries where regulation has increased have also tended to become more concentrated and have invested less.”
Orszag, the former head of the Office of Management and Budget and former Director of the Congressional Budget Office, co-authored a 2015 paper with former Obama economic adviser Jason Furman that explored the rise in “supernormal returns on capital” among firms that have limited competition. In the panel, he spoke about what he described as a “dramatic rise” in dispersion among firms in productivity and wages as an understudied driver of inequality.
“In general, if you look at most textbooks on economics and most discussions of public policy, firms are seen as this uninteresting thing that you have to deal with but don’t want to really get into the innards of. Why do some firms behave differently than others? Having now spent a bunch of time in the private sector, the culture in firms really is quite different. Firms do behave differently from one to another beyond just market structure. Within the same market in the same field, Firm A is not the same as Firm B, as people who work inside those firms know.”
Orszag pointed to OECD data that showed that top global firms have been largely exempted from the decline in productivity that advanced economies experienced over the last 10-15 years. “If there’s a structural explanation for that, whether it’s polarization or market structure or innovation, why is it affecting only the laggards in the industry and not those at the frontier? Secondly, why aren’t there more spillovers from the frontier firms within each sector to others? What is happening to the flow of information or the flow of technique or what have you that’s causing this broad, significant rise in productivity deltas across firms, even within the same sector?” he asked.
Orszag also suggested that contrary to media narratives that present growing gaps between CEO wages and median workers within each firm as a prominent driver of inequality, the bulk of the rise in wage gaps is happening between firms, and not within the firms themselves. Studies, he said, show a dramatic increase in between-firm wage inequality “and very little movement except at the very, very largest firms in within-firm inequality.”
Orszag added: “We don’t know exactly what’s causing this. This may be a sorting of workers. It may be sharing of rents in the form of wages for the top firms. It may be a whole variety of different things. What I do suggest is the vast majority of the discussion on income-and-wage inequality seems to just glide over this whole thing as if it doesn’t exist.”
A holistic approach to inequality and concentration
Khan, who in a recent paper with Sandeep Vaheesan explored the role of monopoly and oligopoly power in perpetuating inequality, argued that the way to understand the connection between market concentration and inequality is to take a more holistic approach.
The connection between excessive market concentration and inequality, she said, has been understudied for a long time. “We were really surprised to see that at the time, in 2014, there really wasn’t much research on this connection at all. The most comprehensive paper that we found was from 1975 by William Comanor and Robert Smiley, which found that monopoly power did in fact transfer wealth to the most affluent members of society and suggested that a more competitive economy would have more progressive redistributive effects,” said Kahn. “One way to understand why this connection between market concentration and inequality has been understudied is that the law decided that it wasn’t really important. Once we shifted from an antitrust approach that took a more holistic and multidimensional view of the effect of market power to an approach that privilege means prices, the research on these effects also took a hit.”
In their paper, Khan and Vaheesan argue that inequality not only harms efficiency, but also that firms use their market power to raise prices “above competitive levels to consumers and push prices below competitive levels for small producers.” The paper makes a case for more rigorous enforcement of antitrust laws, arguing that reinvigorating antitrust could be one possible remedy for the regressive redistributive effects of concentration and the political power of monopolies.
“I think at a very basic level, our current political economy reflects 30 years of doing antitrust in a very particular way,” said Khan, who listed several industries such as airlines, healthcare, pharmaceuticals, and telecom, where prices have risen following mergers and industry consolidation.
“New business creation and growth have been on a secular decline. It’s worth recalling that in an earlier era, owning one’s own business was a form of asset building for the middle class, a way of passing on wealth to one’s children. This is especially still true in immigrant communities, where owning your own bodega or your own dry-cleaning service is a path of upward mobility. You can imagine how markets that shut out independent businesses are also effectively closing off that path of asset building,” said Khan.
Khan went on to discuss the political implications of excessive market power and how they can further entrench inequality. “Big firms and concentrated industries enjoy a level of political power that they can use to further entrench their economic dominance. Politics is another vessel by which we see this,” she said.
Rahman, author of the book Democracy Against Domination (Oxford University Press, 2016), also advocated for a wider view of the issue. “When we’re worried about the problem of concentration, I think it goes much broader than the specific areas of mergers and firm size, although that’s a big part of it,” he said.
“When we think about the good things that we want from the economy, we want it to be dynamic, we want it to be innovative, we want it to enable mobility. These things are not natural products. They are a property of the underlying structure of firms, of labor markets, of financial markets, and of policies, including antitrust,” said Rahman, who went on to discuss two aspects of the rise in concentration: digital platforms and the “Uber-ization” of more and more economic sectors, and what he described as a “growing geographic concentration of wealth, income, and opportunity between rural and urban.”
Rahman suggested that other tools, not just antitrust, could be used to combat excessive market power—particularly when it comes to the power of digital platforms. “The way I want to frame this is as a problem of concentration and inequality that warps the structure of opportunity in our economy,” said Rahman. “You have antitrust and public utility law, corporate governance, and labor law as three parts of the larger ecosystem of law and regulation that, coming out of that Progressive era debate about power, were the three complements that together, it was hoped, would produce a high-opportunity, a high-mobility economy that was open to all.”