Public traded companies are always under pressure to show earnings growth and sales revenue growth to enhance shareholder value.
How do they do it when markets have matured and economy has slowed?
Lower Costs
Increase Market Share
Find New Markets
Diversify
Create New products and services
How do then companies lower their costs?
Vertical Mergers and Acquisitions
Outsourcing (Sourcing parts and components / Intermediate Goods / Inputs from cross border)
Offshoring (Shifting Production cross border)
Vertical Integration
How do then companies increase their market share?
Horizontal Mergers and Acquisitions
Cross Border Markets Share (Sales in other countries)
In the last thirty years, this is exactly what has happened in US economy.
Macro Trends of increase in Outsourcing/Offshoring, Increase in Market Concentration, Increase in Inequality, Increase in Corporate Profits, Rising Equity Prices, Slower Productivity Growth, Lower Interest Rates, Low Labor Share, and Capital Share.
Please see my other posts expanding on these issues.
Please note that these forces are continuing and trends will remain on current trajectory.
Key Terms:
Stakeholder vs Shareholder Capitalism
Short Termism
Slow Productivity Growth
Rising Market Concentration
Rising Profits
Rising Equities Market
Rising Inequality
Dupont Ratio Analysis
Financial Planning (Micro – Firm Level)
Economic Planning (Macro- Aggregate Level)
Quarterly Capitalism
From SHAREHOLDER CAPITALISM: A SYSTEM IN CRISIS
Our current, highly financialised, form of shareholder capitalism is not just failing to provide new capital for investment, it is actively undermining the ability of listed companies to reinvest their own profits. The stock market has become a vehicle for extracting value from companies, not for injecting it.
No wonder that Andy Haldane, Chief Economist of the Bank of England, recently suggested that shareholder capitalism is ‘eating itself.’1 Corporate governance has become dominated by the need to maximise short-term shareholder returns. At the same time, financial markets have grown more complex, highly intermediated, and similarly shorttermist, with shares increasingly seen as paper assets to be traded rather than long term investments in sound businesses.
This kind of trading is a zero-sum game with no new wealth, let alone social value, created. For one person to win, another must lose – and increasingly, the only real winners appear to be the army of financial intermediaries who control and perpetuate the merry-goround. There is nothing natural or inevitable about the shareholder-owned corporation as it currently exists. Like all economic institutions, it is a product of political and economic choices which can and should be remade if they no longer serve our economy, society, or environment.
Here’s the impact this shareholder model is currently having:
• Economy: Shareholder capitalism is holding back productive investment. Even the Chief Executive of BlackRock, the world’s largest asset manager, has admitted that pressure to keep the share price high means corporate leaders are ‘underinvesting in innovation, skilled workforces or essential capital expenditures.’ 2
• Society: Shareholder capitalism is driving inequality. There is growing evidence that attempts to align executive pay with shareholder value are largely responsible for the ballooning of salaries at the top. The prioritisation of shareholder interests has also contributed to a dramatic decline in UK wages relative to profits, helping to explain the failure of ordinary people’s living standards to rise in line with economic growth.
• Environment: Shareholder capitalism helps to drive environmental destruction. It does this by driving risky shortterm behaviour, such as fossil fuel extraction, which ignores long-term environmental risks.
The idea that shareholder capitalism is the most efficient way to mobilise large amounts of capital is no longer tenable.
We need both to create new models of companies, and implement new ways of organising investment that are fit for building an inclusive, equal, and sustainable economy.
Companies should be explicitly accountable to a mission and a set of interests beyond shareholder returns. Equally, investment must provide long-term capital for socially and environmentally useful projects, and damaging forms of speculation must be restricted.
For most people, our economy simply is not working, and the damaging aspects of shareholder capitalism are at least in part responsible. Reforming shareholder capitalism must not be dismissed as too difficult – the crisis is too urgent for that. We can take the first steps towards a better economic model right now. It’s time to act.
A Crash Course in Dupont Financial Ratio Analysis
What happens when economic growth slows ?
What happens when profit margins decline ?
What happens when Sales growth is limited ?
What does lead to Mergers and Acquisitions ?
What is the impact of Cost of Capital ?
What is EVA (Economic Value Added) ?
What is impact of Outsourcing/Offshoring on Financial Ratios ?
What is impact of Mergers and Acquisitions on Financial Ratios ?
What is impact of Stock Buy Backs on Financial Ratios ?
What is impact of Dividends on Financial Ratios ?
ROS (Return on Sales)
ROE (Return on Equities)
ROA (Return on Assets)
ROIC (Return on Invested Capital)
EVA (Economic Value Added)
MVA (Market Value Added)
From The DuPont Equation, ROE, ROA, and Growth
The DuPont Equation
The DuPont equation is an expression which breaks return on equity down into three parts: profit margin, asset turnover, and leverage.
Learning Objectives
Explain why splitting the return on equity calculation into its component parts may be helpful to an analyst
Key Takeaways
Key Points
By splitting ROE into three parts, companies can more easily understand changes in their returns on equity over time.
As profit margin increases, every sale will bring more money to a company’s bottom line, resulting in a higher overall return on equity.
As asset turnover increases, a company will generate more sales per asset owned, resulting in a higher overall return on equity.
Increased financial leverage will also lead to an increase in return on equity, since using more debt financing brings on higher interest payments, which are tax deductible.
Key Terms
competitive advantage: something that places a company or a person above the competition
The DuPont Equation
DuPont Model: A flow chart representation of the DuPont Model.
The DuPont equation is an expression which breaks return on equity down into three parts. The name comes from the DuPont Corporation, which created and implemented this formula into their business operations in the 1920s. This formula is known by many other names, including DuPont analysis, DuPont identity, the DuPont model, the DuPont method, or the strategic profit model.
The DuPont Equation: In the DuPont equation, ROE is equal to profit margin multiplied by asset turnover multiplied by financial leverage.
Under DuPont analysis, return on equity is equal to the profit margin multiplied by asset turnover multiplied by financial leverage. By splitting ROE (return on equity) into three parts, companies can more easily understand changes in their ROE over time.
Components of the DuPont Equation: Profit Margin
Profit margin is a measure of profitability. It is an indicator of a company’s pricing strategies and how well the company controls costs. Profit margin is calculated by finding the net profit as a percentage of the total revenue. As one feature of the DuPont equation, if the profit margin of a company increases, every sale will bring more money to a company’s bottom line, resulting in a higher overall return on equity.
Components of the DuPont Equation: Asset Turnover
Asset turnover is a financial ratio that measures how efficiently a company uses its assets to generate sales revenue or sales income for the company. Companies with low profit margins tend to have high asset turnover, while those with high profit margins tend to have low asset turnover. Similar to profit margin, if asset turnover increases, a company will generate more sales per asset owned, once again resulting in a higher overall return on equity.
Components of the DuPont Equation: Financial Leverage
Financial leverage refers to the amount of debt that a company utilizes to finance its operations, as compared with the amount of equity that the company utilizes. As was the case with asset turnover and profit margin, Increased financial leverage will also lead to an increase in return on equity. This is because the increased use of debt as financing will cause a company to have higher interest payments, which are tax deductible. Because dividend payments are not tax deductible, maintaining a high proportion of debt in a company’s capital structure leads to a higher return on equity.
The DuPont Equation in Relation to Industries
The DuPont equation is less useful for some industries, that do not use certain concepts or for which the concepts are less meaningful. On the other hand, some industries may rely on a single factor of the DuPont equation more than others. Thus, the equation allows analysts to determine which of the factors is dominant in relation to a company’s return on equity. For example, certain types of high turnover industries, such as retail stores, may have very low profit margins on sales and relatively low financial leverage. In industries such as these, the measure of asset turnover is much more important.
High margin industries, on the other hand, such as fashion, may derive a substantial portion of their competitive advantage from selling at a higher margin. For high end fashion and other luxury brands, increasing sales without sacrificing margin may be critical. Finally, some industries, such as those in the financial sector, chiefly rely on high leverage to generate an acceptable return on equity. While a high level of leverage could be seen as too risky from some perspectives, DuPont analysis enables third parties to compare that leverage with other financial elements that can determine a company’s return on equity.
ROE and Potential Limitations
Return on equity measures the rate of return on the ownership interest of a business and is irrelevant if earnings are not reinvested or distributed.
Learning Objectives
Calculate a company’s return on equity
Key Takeaways
Key Points
Return on equity is an indication of how well a company uses investment funds to generate earnings growth.
Returns on equity between 15% and 20% are generally considered to be acceptable.
Return on equity is equal to net income (after preferred stock dividends but before common stock dividends) divided by total shareholder equity (excluding preferred shares ).
Stock prices are most strongly determined by earnings per share (EPS) as opposed to return on equity.
Key Terms
fundamental analysis: An analysis of a business with the goal of financial projections in terms of income statement, financial statements and health, management and competitive advantages, and competitors and markets.
Return On Equity
Return on equity (ROE) measures the rate of return on the ownership interest or shareholders’ equity of the common stock owners. It is a measure of a company’s efficiency at generating profits using the shareholders’ stake of equity in the business. In other words, return on equity is an indication of how well a company uses investment funds to generate earnings growth. It is also commonly used as a target for executive compensation, since ratios such as ROE tend to give management an incentive to perform better. Returns on equity between 15% and 20% are generally considered to be acceptable.
The Formula
Return on equity is equal to net income, after preferred stock dividends but before common stock dividends, divided by total shareholder equity and excluding preferred shares.
Return On Equity: ROE is equal to after-tax net income divided by total shareholder equity.
Expressed as a percentage, return on equity is best used to compare companies in the same industry. The decomposition of return on equity into its various factors presents various ratios useful to companies in fundamental analysis.
ROE Broken Down: This is an expression of return on equity decomposed into its various factors.
The practice of decomposing return on equity is sometimes referred to as the “DuPont System. ”
Potential Limitations of ROE
Just because a high return on equity is calculated does not mean that a company will see immediate benefits. Stock prices are most strongly determined by earnings per share (EPS) as opposed to return on equity. Earnings per share is the amount of earnings per each outstanding share of a company’s stock. EPS is equal to profit divided by the weighted average of common shares.
Earnings Per Share: EPS is equal to profit divided by the weighted average of common shares.
The true benefit of a high return on equity comes from a company’s earnings being reinvested into the business or distributed as a dividend. In fact, return on equity is presumably irrelevant if earnings are not reinvested or distributed.
Assessing Internal Growth and Sustainability
Sustainable– as opposed to internal– growth gives a company a better idea of its growth rate while keeping in line with financial policy.
Learning Objectives
Calculate a company’s internal growth and sustainability ratios
Key Takeaways
Key Points
The internal growth rate is a formula for calculating the maximum growth rate a firm can achieve without resorting to external financing.
Sustainable growth is defined as the annual percentage of increase in sales that is consistent with a defined financial policy.
Another measure of growth, the optimal growth rate, assesses sustainable growth from a total shareholder return creation and profitability perspective, independent of a given financial strategy.
Key Terms
retention: The act of retaining; something retained
retention ratio: retained earnings divided by net income
sustainable growth rate: the optimal growth from a financial perspective assuming a given strategy with clear defined financial frame conditions/ limitations
Internal Growth and Sustainability
The true benefit of a high return on equity arises when retained earnings are reinvested into the company’s operations. Such reinvestment should, in turn, lead to a high rate of growth for the company. The internal growth rate is a formula for calculating maximum growth rate that a firm can achieve without resorting to external financing. It’s essentially the growth that a firm can supply by reinvesting its earnings. This can be described as (retained earnings)/(total assets ), or conceptually as the total amount of internal capital available compared to the current size of the organization.
We find the internal growth rate by dividing net income by the amount of total assets (or finding return on assets ) and subtracting the rate of earnings retention. However, growth is not necessarily favorable. Expansion may strain managers’ capacity to monitor and handle the company’s operations. Therefore, a more commonly used measure is the sustainable growth rate.
Sustainable growth is defined as the annual percentage of increase in sales that is consistent with a defined financial policy, such as target debt to equity ratio, target dividend payout ratio, target profit margin, or target ratio of total assets to net sales.
We find the sustainable growth rate by dividing net income by shareholder equity (or finding return on equity) and subtracting the rate of earnings retention. While the internal growth rate assumes no financing, the sustainable growth rate assumes you will make some use of outside financing that will be consistent with whatever financial policy being followed. In fact, in order to achieve a higher growth rate, the company would have to invest more equity capital, increase its financial leverage, or increase the target profit margin.
Optimal Growth Rate
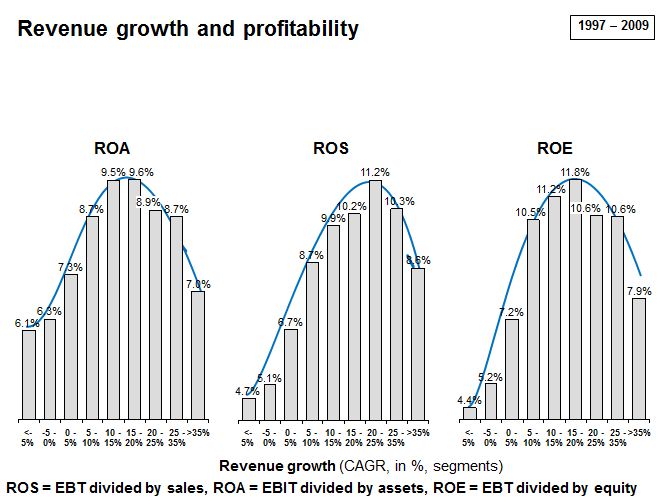
Another measure of growth, the optimal growth rate, assesses sustainable growth from a total shareholder return creation and profitability perspective, independent of a given financial strategy. The concept of optimal growth rate was originally studied by Martin Handschuh, Hannes Lösch, and Björn Heyden. Their study was based on assessments on the performance of more than 3,500 stock-listed companies with an initial revenue of greater than 250 million Euro globally, across industries, over a period of 12 years from 1997 to 2009.
Revenue Growth and Profitability: ROA, ROS and ROE tend to rise with revenue growth to a certain extent.
Due to the span of time included in the study, the authors considered their findings to be, for the most part, independent of specific economic cycles. The study found that return on assets, return on sales and return on equity do in fact rise with increasing revenue growth of between 10% to 25%, and then fall with further increasing revenue growth rates. Furthermore, the authors attributed this profitability increase to the following facts:
Companies with substantial profitability have the opportunity to invest more in additional growth, and
Substantial growth may be a driver for additional profitability, whether by attracting high performing young professionals, providing motivation for current employees, attracting better business partners, or simply leading to more self-confidence.
However, according to the study, growth rates beyond the “profitability maximum” rate could bring about circumstances that reduce overall profitability because of the efforts necessary to handle additional growth (i.e., integrating new staff, controlling quality, etc).
Dividend Payments and Earnings Retention
The dividend payout and retention ratios offer insight into how much of a firm’s profit is distributed to shareholders versus retained.
Learning Objectives
Calculate a company’s dividend payout and retention ratios
Key Takeaways
Key Points
Many corporations retain a portion of their earnings and pay the remainder as a dividend.
Dividends are usually paid in the form of cash, store credits, or shares in the company.
Cash dividends are a form of investment income and are usually taxable to the recipient in the year that they are paid.
Dividend payout ratio is the fraction of net income a firm pays to its stockholders in dividends.
Retained earnings can be expressed in the retention ratio.
Key Terms
stock split: To issue a higher number of new shares to replace old shares. This effectively increases the number of shares outstanding without changing the market capitalization of the company.
Dividend Payments and Earnings Retention
Dividends are payments made by a corporation to its shareholder members. It is the portion of corporate profits paid out to stockholders. On the other hand, retained earnings refers to the portion of net income which is retained by the corporation rather than distributed to its owners as dividends. Similarly, if the corporation takes a loss, then that loss is retained and called variously retained losses, accumulated losses or accumulated deficit. Retained earnings and losses are cumulative from year to year with losses offsetting earnings. Many corporations retain a portion of their earnings and pay the remainder as a dividend.
A dividend is allocated as a fixed amount per share. Therefore, a shareholder receives a dividend in proportion to their shareholding. Retained earnings are shown in the shareholder equity section in the company’s balance sheet –the same as its issued share capital.
Public companies usually pay dividends on a fixed schedule, but may declare a dividend at any time, sometimes called a “special dividend” to distinguish it from the fixed schedule dividends. Dividends are usually paid in the form of cash, store credits (common among retail consumers’ cooperatives), or shares in the company (either newly created shares or existing shares bought in the market). Further, many public companies offer dividend reinvestment plans, which automatically use the cash dividend to purchase additional shares for the shareholder.
Cash dividends (most common) are those paid out in currency, usually via electronic funds transfer or a printed paper check. Such dividends are a form of investment income and are usually taxable to the recipient in the year they are paid. This is the most common method of sharing corporate profits with the shareholders of the company. For each share owned, a declared amount of money is distributed. Thus, if a person owns 100 shares and the cash dividend is $0.50 per share, the holder of the stock will be paid $50. Dividends paid are not classified as an expense but rather a deduction of retained earnings. Dividends paid do not show up on an income statement but do appear on the balance sheet.
Example Balance Sheet: Retained earnings can be found on the balance sheet, under the owners’ (or shareholders’) equity section.
Stock dividends are those paid out in the form of additional stock shares of the issuing corporation or another corporation (such as its subsidiary corporation). They are usually issued in proportion to shares owned (for example, for every 100 shares of stock owned, a 5% stock dividend will yield five extra shares). If the payment involves the issue of new shares, it is similar to a stock split in that it increases the total number of shares while lowering the price of each share without changing the market capitalization, or total value, of the shares held.
Dividend Payout and Retention Ratios
Dividend payout ratio is the fraction of net income a firm pays to its stockholders in dividends:
The part of the earnings not paid to investors is left for investment to provide for future earnings growth. These retained earnings can be expressed in the retention ratio. Retention ratio can be found by subtracting the dividend payout ratio from one, or by dividing retained earnings by net income.
Dividend Payout Ratio: The dividend payout ratio is equal to dividend payments divided by net income for the same period.
Relationships between ROA, ROE, and Growth
Return on assets is a component of return on equity, both of which can be used to calculate a company’s rate of growth.
Learning Objectives
Discuss the different uses of the Return on Assets and Return on Assets ratios
Key Takeaways
Key Points
Return on equity measures the rate of return on the shareholders ‘ equity of common stockholders.
Return on assets shows how profitable a company’s assets are in generating revenue.
In other words, return on assets makes up two-thirds of the DuPont equation measuring return on equity.
Capital intensity is the term for the amount of fixed or real capital present in relation to other factors of production. Rising capital intensity pushes up the productivity of labor.
Key Terms
return on common stockholders’ equity: a fiscal year’s net income (after preferred stock dividends but before common stock dividends) divided by total equity (excluding preferred shares), expressed as a percentage
quantitatively: With respect to quantity rather than quality.
Return On Assets Versus Return On Equity
In review, return on equity measures the rate of return on the ownership interest (shareholders’ equity) of common stockholders. Therefore, it shows how well a company uses investment funds to generate earnings growth. Return on assets shows how profitable a company’s assets are in generating revenue. Return on assets is equal to net income divided by total assets.
Return On Assets: Return on assets is equal to net income divided by total assets.
This percentage shows what the company can do with what it has (i.e., how many dollars of earnings they derive from each dollar of assets they control). This is in contrast to return on equity, which measures a firm’s efficiency at generating profits from every unit of shareholders’ equity. Return on assets is, however, a vital component of return on equity, being an indicator of how profitable a company is before leverage is considered. In other words, return on assets makes up two-thirds of the DuPont equation measuring return on equity.
ROA, ROE, and Growth
In terms of growth rates, we use the value known as return on assets to determine a company’s internal growth rate. This is the maximum growth rate a firm can achieve without resorting to external financing. We use the value for return on equity, however, in determining a company’s sustainable growth rate, which is the maximum growth rate a firm can achieve without issuing new equity or changing its debt-to-equity ratio.
Capital Intensity and Growth
Return on assets gives us an indication of the capital intensity of the company. “Capital intensity” is the term for the amount of fixed or real capital present in relation to other factors of production, especially labor. The underlying concept here is how much output can be procured from a given input (assets!). The formula for capital intensity is below:
Capital Intensity=Total AssetsSales
The use of tools and machinery makes labor more effective, so rising capital intensity pushes up the productivity of labor. While companies that require large initial investments will generally have lower return on assets, it is possible that increased productivity will provide a higher growth rate for the company. Capital intensity can be stated quantitatively as the ratio of the total money value of capital equipment to the total potential output. However, when we adjust capital intensity for real market situations, such as the discounting of future cash flows, we find that it is not independent of the distribution of income. In other words, changes in the retention or dividend payout ratios can lead to changes in measured capital intensity.
This document was prepared by the OECD Secretariat to serve as an issues paper for the hearing on market concentration taking place at the 129th meeting of the OECD Competition Committee on 6-8 June 2018
Rising Market Concentration and Declining Business Investments in the USA – Update June 2018
Since my last posts in August/September 2017 on the subject of
Market Concentration
Inequality
Market Power
Reduced Competition
Reduced Dynamism
Rising Profits
Declining Business Investments
several new studies have been published. In addition, several important hearings and conferences have been organized by OECD, Brookings Institution, Boston University School of Law. Please see my list of references for details of each one of them.
This topic now is getting good attention in media also.
The Peterson Institute for International Economics (PIIE) held a major research conference on the “Policy Implications of Sustained Low Productivity Growth” on November 9, 2017. Jeromin Zettelmeyer, PIIE, moderates panel 4, “Wages and Inequality.” Presenters include Jason Furman, Harvard University and PIIE, and Lawrence H. Summers, Harvard University. I have given the link to Video of the session 4 in the references.
OECD on June 7-8, 2018 held hearings on Market Concentration at Paris, France. Several presentations were given by experts in the field. I have given link to the conference webpage in the references.
The Hamilton Project/Brookings Institution had a Conference on June 13, 2018 in Washington DC on the subject of Market Concentration. Please see the link to the conference video and papers in the references below.
From The State of Competition and Dynamism: Facts about Concentration, Start-Ups, and Related Policies
From The State of Competition and Dynamism: Facts about Concentration, Start-Ups, and Related Policies
One of the key source of International Trade statistics is a document published by the UNCTAD since 2013:
Key Statistics and Trends in International Trade
Please see references below to access reports for 2015 and 2016.
In 2014, out of USD 18.5 trillion in global trade, about USD 8 trillion was in intermediate goods.
From TRADE IN INTERMEDIATE GOODS AND SERVICES
Introduction: the international dimension of the exchange of intermediate inputs
1. Trade in intermediate inputs has been steadily growing over the last decade. However, despite the internationalisation of production and the increasing importance of outsourcing and foreign investment, some studies have found little rise in intermediate goods trade as a share of total trade1. More than half of goods trade is however made up of intermediate inputs and trade in services is even more of an intermediate type with about three quarters of trade flows being comprised of intermediate services. Trade in intermediate goods and services thus deserves special attention from trade policymakers and so far few studies have investigated how it differs from trade in consumption goods or services.
2. An intermediate good can be defined as an input to the production process that has itself been produced and, unlike capital, is used up in production3. The difference between intermediate and capital goods lies in the latter entering as a fixed asset in the production process. Like any primary factor (such as labour, land, or natural resources) capital is used but not used up in the production process4. On the contrary, an intermediate good is used, often transformed, and incorporated in the final output. As an input, an intermediate good has itself been produced and is hence defined in contrast to a primary input. As an output, an intermediate good is used to produce other goods (or services) contrary to a final good which is consumed and can be referred to as a “consumption good”.
3. Intermediate inputs are not restricted to material goods; they can also consist of services. Thelatter can be potentially used as an input to any sector of the economy; that is for the production of the same, or other services, as well as manufacturing goods. Symmetrically, manufacturing goods can be potentially used to produce the same, or other manufacturing goods, as well as services.
4. An important question we can ask is how to identify inputs among all goods and services produced in an economy. Many types of goods can be easily distinguished as inputs, when their use excludes them from final consumption. Notable examples include chemical substances, construction materials, or business services. The exact same type of good used as an input to some production process can however be destined to consumption. For instance, oranges can be sold to households as a final good, as well as to a factory as an input for food preparation. Telecommunication services can be sold to individuals or to business services firms as an intermediate input for their output. The United Nations distinguish commodities in each basic heading on the basis of the main end-use (United Nations, 2007). It is however recognized that many commodities that are traded internationally may be put to a variety of uses. Other methodologies involve the use of input-output (I-O) tables to distinguish between intermediate and consumption goods.
5. The importance of intermediate goods and services in the economy and trade is associated with a number of developments in the last decades. Growth and increased sophistication of production has given birth to strategies involving fragmentation and reorganisation of firm’s activities, both in terms of ownership boundaries, as in terms of the location for production. In what follows, the international dimension of the exchange of intermediate goods and services is explored by clarifying terms and concepts as well as the links between trade in intermediate inputs and FDI.
From Key Statistics and Trends in International Trade 2015
From Key Statistics and Trends in International Trade 2015
From Key Statistics and Trends in International Trade 2015
From Key Statistics and Trends in International Trade 2015
From Key Statistics and Trends in International Trade 2015
From Key Statistics and Trends in International Trade 2015
From Key Statistics and Trends in International Trade 2015
From Key Statistics and Trends in International Trade 2015
From Key Statistics and Trends in International Trade 2015
Trade networks relating to global value chains have evolved during the last 10 years. In 2004, the East Asian production network was still in its infancy. Most trade flows of parts and components concerned the USA and the European Union, with a number of other countries loosely connected with these two main hubs. As of 2014 trade of parts and components was much more developed. The current state is characterized not only by the prominent role of China, but also by a much more tightly integrated network with a much larger number of countries many of which have multiple connections to different hubs.
From Mapping Global Value Chains: Intermediate Goods Trade and Structural Change in the World Economy
Key sources of Research:
TRADE IN INTERMEDIATE GOODS AND SERVICES
OECD Trade Policy Working Paper No. 93
by Sébastien Miroudot, Rainer Lanz and Alexandros Ragoussis
The Similarities and Differences among Three Major Inter-Country Input-Output Databases and their Implications for Trade in Value-Added Estimates
Lin Jones and Zhi Wang, United States International Trade Commission Li Xin, Beijing Normal University and Peking University Christophe Degain, World Trade Organization
There are several institutions which publish economic forecasts annually/quarterly.
IMF
OECD
EC
Central Banks of Nations also publish economic Forecasts. For Example:
Federal Reserve Bank of USA
Bank of England
Bank of Canada
Riksbank of Sweden
European Central Bank
There are several surveys of professional forecasters which create consensus forecasts to improve the accuracy of forecasts.
US Fed Reserve Survey of Professional Forecasters
ECB Survey of Professional Forecasters
Consensus Forecasts by Consensus Forecasts
Federal Reserve Blue Book
Federal Reserve Livingston Survey
Blue Chip Economic Forecasts by Wolters Kluwers
International Forecasting organizations (Private and Government)
IMF, “World Economic Outlook”;
EC, “European Economic Forecast”;
OECD, “OECD Economic Outlook”;
Consensus Economics, “Consensus Forecasts”;
The Economist, “The Economist pool of forecasters”.
USA Private and Government Economic Forecasters
Fed Reserve Survey of Professional Forecasters
Blue Chip Economic Indicators ( Wolters Kluwer)
Green Book
Livingston Survey
CBO
FOMC
Office of Management and Budget (OMB)
Western Blue Chip Economic Forecast
From Swiss Re Report May 2017
From Gauging the Uncertainty of the Economic Outlook Using Historical Forecasting Errors: The Federal Reserve’s Approach
Surveys of Economic Forecasters:
USA Private Economic Forecasters
There are many private forecasters who also publish forecasts. For Example:
The Conference Board
Wells Fargo Bank
Goldman Sachs
Citi Group
Haver Analytics
RSQE Forecasts at University of Michigan
See the lists below for almost all of professional forecasters.
From Blue Chip Economic Forecast:
From Social Learning, Strategic Incentives and Collective Wisdom: An Analysis of the Blue Chip Forecasting Group
There is also in UK:
NIESR ( National Institute of Economic and Social Research)
From time to time many of these organizations review quality of their forecasts. Results of these studies are published in papers many of which are listed in references below.
After the global financial Crisis of 2008-2009, many institutions have taken another look at their models used for forecasting economic variables.
See recent papers by
Bank of Canada
IMF
OECD
Fed Reserve
Bank of England
Riksbank of Sweden
US CBO
Bank of Portugal
European Commission
From Gauging the Uncertainty of the Economic Outlook Using Historical Forecasting Errors: The Federal Reserve’s Approach
Since late 2007, the Federal Open Market Committee (FOMC) of the U.S. Federal Reserve has regularly published assessments of the uncertainty associated with the projections of key macroeconomic variables made by individual Committee participants.1 These assessments, which are reported in the Summary of Economic Projections (SEP) that accompanies the FOMC minutes once a quarter, provide two types of information about forecast uncertainty. The first is qualitative in nature and summarizes the answers of participants to two questions: Is the uncertainty associated with his or her own projections of real activity and inflation higher, lower or about the same as the historical average? And are the risks to his or her own projections weighted to the upside, broadly balanced, or weighted to the downside? The second type of information is quantitative and provides the historical basis for answering the first qualitative question. Specifically, the SEP reports the root mean squared errors (RMSEs) of real-time forecasts over the past 20 years made by a group of leading private and public sector forecasters.
Some have blamed the entire economics profession. Several attempts are being made to improve economic analysis. Examples include work being done at
INET ( Institute for New Economic Thinking)
NAEC at OECD
Heterodox schools of economics are making claims to accuracy of their approach after failure of main stream orthodox New Classical economics in predicting the Global Financial Crisis.
I will create another post later for some of these issues.
GDP forecasts errors have been attributed to errors in GDP components of business investments and exports.
Variability of GDP forecasts from short term to long term
Variability of GDP forecasts between forecasters – private and governments
Key Sources of Research:
The Case of Serial Disappointment
Justin‐Damien Guénette, Nicholas Labelle St‐Pierre, Martin Leduc and
Lori Rennison
Bank of Canada Staff Analytical Note 2016-10
July 2016
Development of Global Trade and Production Accounts: UN SEIGA Initiative
UNSD is developing a handbook on
System of Extended International and Global Accounts (SEIGA)
Statistics to guide policy making has lagged behind dramatic changes in interconnectedness among nations.
Financial Globalization
Trade Globalization
Climate and Environmental Globalization
Economic Integration
Digital Globalization – Data and Information Flows
People Movements Globalization
Efforts are underway to correct data and statistics measurement and collection.
OECD/WTO Trade in Value Added
EU/EUROSTAT Multi Country Input-Output Tables
UN SEEA
UN SEIGA
UNECE Global Production
EUROSTAT FIGARO
EUROSTAT IGA
From 2014 International Conference on Measurement of Trade and Economic Globalization
Measurement of International Trade and Economic Globalization
Concept Note
In recent years, concerns were raised about the shortcomings of the existing official trade statistics for the purpose of reflecting bilateral economic relations. The high level of import content in exports makes gross bilateral trade statistics unsuitable for bilateral trade negotiations. Trade analysis requires new measures which better reflect the level of interdependencies among countries engaged in global value chains (GVCs). In order to understand the true nature of trade relationships, we need to know what each country along a global value chain contributes to the value of a final product. We also need to know how that contribution is linked to those of other suppliers in other countries coming before and after along the chain, and how much employment and income is generated through this value addition.
The statistical community responded to these concerns through a number of initiatives, such as the UN/Eurostat/WTO Global Forum on Trade Statistics in 2011, the OECD-WTO initiative on Trade in Value-Added launched in 2012, and the 2013 Eurostat report on Global Value Chains. An official response was delivered by bringing the measurement of international trade and economic globalization to the agenda of the UN Statistical Commission in 20131 and again in 20142. The corresponding decisions of the Commission stress the need for a measurement framework and a mechanism for coordination. Specifically, in Decision 44/1063 of its session in 2013, the Commission recognized the need for an overarching measurement framework for international trade and economic globalization, taking into account the existing frameworks and guidelines of the System of National Accounts, Balance of Payments, and the Guidelines on Integrated Economic Statistics, as well as the research and studies done by Eurostat, the OECD, the IMF and various working groups. The Commission also recognized the need for an appropriate mechanism for coordination of the work in this field, ensuring that the functions of the existing expert groups, working groups and task forces are accounted for at the international and regional levels. In the same decision, the Commission agreed to the creation of a “friends of the chair” (FOC) group tasked with preparing a concept paper on the scope and content of the framework, and on the appropriate mechanism for coordination of the work in this area.
The global economy is increasingly structured around GVCs that account for a rising share of international trade, global GDP and employment. GVCs link firms, workers and consumers around the world and often provide a stepping stone for firms and workers in developing countries to integrate into the global economy. A GVC describes the full range of activities that firms and workers perform to bring a product from its conception to end use. This includes activities such as design, production, marketing, distribution and support to the final consumer. The activities that comprise a value chain can be contained within a single firm or divided among different firms. In the context of globalization, the activities that constitute a value chain have generally been carried out in inter-firm networks on a global scale. The dependency structures of the firms in the GVC networks are of crucial importance in order to measure where income, knowledge and employment are generated, and to understand potential risk and vulnerabilities in case of a future financial crisis. Within this changed economic landscape, more complex measures of trade and production are necessary both on micro-and macro-economic level.
In other words, national economies relate to one another in a number of ways be it through trade in goods, trade in services, tourism, foreign direct investment, establishment of foreign affiliates, transfer of knowledge, creation of jobs, redistribution of income, migrant workers, emissions of CO2 or in other ways. A comprehensive way of charting those interdependencies is through a global Supply and Use table (SUT), in which countries connect through imports and exports of goods and services into and out of specific industries. Ideally, the global SUT contains for each international flow an export of a product from an industry of one country into an industry (or into final consumption) of another country, as the corresponding and matching import. In principle, only one global SUT should exist to be used by all national and international agencies for the analysis of trade and globalization. Besides the implicitly mentioned matching of bilateral trade flows (both for goods and services), further refinement may be necessary regarding the use of inputs by type of enterprise for either the domestic or the international market, including the special cases of multi-national enterprises and their foreign affiliates, goods for processing (manufacturing services) and re-exports. Further details on such global SUT were described in a recent paper of the OECD.
Compiling a global SUT requires a very close alignment and harmonization of national SUTs, price statistics and trade statistics. To achieve this in the short term, some practical decisions need to be taken and agreed upon internationally for the creation of a symmetrical and fully balanced bilateral trade matrix at the global level, which would have buy-in, cooperation and endorsement of all concerned countries. This matrix would be built strictly for the purpose of compiling an internationally recognized and accepted SUT. In the longer term, the existing recommendations for international trade statistics would need to be reviewed with the purpose of making them more symmetrical in terms of the reporting of exports and imports, and thus more suitable for the compilation of a global SUT.
A System of International Accounts.
The implications of building a global SUT [for the purpose of deriving, for instance, indicators for Trade in Value Added or Trade in Jobs] are farther reaching than just addressing asymmetries in trade and heterogeneity in firms. The underlying concepts and definitions as basis for measurement of these international statistics would need to be reviewed as well. In terms of the System of National Accounts, the Rest of the World Account would need to be more explicitly defined, especially since a global SUT implies a perfect alignment of international flows, and some international recommendations regarding heterogeneity of firms (where economically relevant). In the longer term, this set of new concepts and definitions could form a System of International Accounts, as the measurement framework for international trade and economic globalization.
From The relevance of multi-country input-output tables in measuring emissions trade balance of countries: the case of Spain
Background and statistical context
The latest meeting of the Group of Experts on National Accounts of the United Nations Economic Commission for Europe (UNECE, 7-9 July 2015), was devoted to data collection and compilation methods in respect to global production activities. It was jointly organized with Eurostat and the Organization for Economic Co-operation and Development (OECD). The meeting was attended by representatives from more than thirty countries worldwide and representatives from the European Commission (EC), International Monetary Fund (IMF), OECD, the United Nations Conference on Trade and Development (UNCTAD), United Nations Statistics Division (UNSD) and World Trade Organization (WTO), among others.
According to the experts at this UNECE meeting, in order to measure global production and global value chains it is no longer sufficient to look only at what a firm does, but to also to consider how the firm does its activities and with whom. For instance, linking business statistics and trade statistics on a micro level should provide new dimensions to the data as long as new balancing challenges at the macro level data (e.g. national accounts). Indeed, statisticians have not always been able to keep up to date with business practices and must find ways to be forward looking and provide the information that meets future policy needs. Traditional measures of trade in goods and services have to be progressively supplemented with information on income and financial flows. Foreign direct investment statistics (FDI) should be further developed and complemented with foreign affiliate statistics (FATS) in order to improve their clarity, usefulness and coverage, and to provide better insights into global value chains.
In this respect, the UNECE Report emanating from this meeting supported new global initiatives, such as the extensions to Trade in Value Added and Global Input- Output Tables (OECD), the construction of the European Multi-Country Input-Output Framework (EC and Eurostat) as well as the elaboration of a new Handbook on a System of Extended International and Global Accounts (UNSD).
Hence, there is no doubt that globalization is currently affecting the way statisticians are measuring national production of countries and international statistical organizations are indeed very busy working on it in order to meet the policy needs at the worldwide level. As national accounts and input-output tables became an integral part of the production activities of national statistical institutes in the past, very soon multi-country and international input-output tables will become a crucial statistical tool to measure global production, trade in value added, environmental footprints and/or employment effects of export activities with official statistics (e.g. carbon footprint estimated by Eurostat).
Bearing all this in mind, we would like to illustrate in this paper the usefulness of global/world input-output tables in measuring the greenhouse gas footprints of individual countries and its external emission trade balance with respect to others. Hopefully, these types of indicators will soon become regularly produced in the future by statisticians using official global input-output tables instead of using other databases produced as one-off projects (e.g. World Input-Output Database, WIOD – http://www.wiod.org).
From 2016 Meeting of the UN Expert Group on International Trade and Globalization Statistics
Concept Note
Following Decision 46/107 taken by the Statistical Commission at its 46th session in 2015, a handbook on a system of extended international and global accounts will be prepared, which will serve as the measurement framework for international trade and economic globalization. This handbook will build on existing work in this area, in particular by the UNECE, the OECD and Eurostat, and address issues of micro-data linking of business and trade statistics, as well as address the integration of economic, environmental and social dimensions of trade and globalization as an extension of the System of National Accounts 2008 (2008 SNA) and the System of Environmental-Economic Accounting 2012 (SEEA 2012).
The first meeting of the expert group is scheduled to take place on 26-28 January 2016 at the UN headquarters in New York. The Handbook is of course the main topic of discussion at this meeting.
The Handbook will refer to and build upon the work of the Friend of the Chair group, which concluded that improved statistics are necessary and should bring a better understanding of the role of the external sector in an economy, the openness of its domestic and foreign markets and the impact of openness on social, economic and environmental upgrading, including the level and quality of employment. More and better data is needed in developed, emerging and developing economies alike: interconnected economies require interconnected statistics and all economies can benefit from a better understanding of these relationships.
As stated in the 2015 FOC report, policymakers and trade negotiators need to understand the cross-country benefits and risks by being able to “look through” the global value chains and see the specific contributions other countries are making to production networks involving their domestic firms. The GVC approach was suggested by the international statistical community as the preferred way of measuring the interconnectedness of economies with respect to jobs, skills, international competitiveness and the creation of value added, income and jobs. The activities involved in GVCs can be grouped into broad stages of production from upstream research and design, through manufacturing, to downstream logistics, marketing and sales. In a GVC, many of the tasks are “offshored”, either through an enterprise’s own affiliates located in foreign countries or through independent contractors. It is this newly emerged international economic integration of production and trade and their governance that has to be better measured and analyzed, including in respect of the benefits, costs and risks associated with engaging in GVCs.
The Handbook can build upon the recommendations and guidelines provided in UNECE’s Guide to Measuring Global Production. This Guide was released at the end of 2015 and provides valuable insights in the functioning and measurement of global value chains. The Guide provides a typology of global production arrangements and describes the principles of ownership inside a multi-national enterprise, as well as ownership of intellectual property products inside global production. In addition, data source and compilation challenges are addressed with special attention to large and complex enterprises.
The Handbook can also build on work presented at the International Conference on Measurement of Trade and Economic Globalization in Mexico in 2014. For example, it could use the value chain reference model to establish alternative aggregations of basic ISIC categories. Those aggregations can be based on enterprise activities in the offshoring of business functions, the use of intermediate inputs, the kinds of basic classes of goods produced and the variety of end markets. The reason for making those distinctions is that it is not possible, in the current ISIC, to distinguish the significant differences between enterprises that operate domestically and those that operate globally. Harmonization of enterprises into groups of similar make-up could significantly improve the accounting structure of the supply and use tables for the analysis of global value chains; harmonization could be achieved in terms of industry, supply chain position, end markets and the extent of the use of business functions being outsourced.
The OECD expert group on extended Supply-Use Tables addresses the estimation methods of trade in value added. The terms of reference of the group states among others that globalization is rapidly changing long-standing assumptions about the relative homogeneity of the production functions (Input-Output technical coefficients) of units classified to a given industrial activity, which is, implicitly, an underlying assumption used in creating input-output based indicators. The increasing prevalence of new types of firms such as factoryless producers and contract processing firms, and the increasing tendency for horizontal, as opposed to vertical, specialization, particularly for multinational affiliates, has fundamentally challenged these assumptions. Therefore, the OECD expert group is looking for the best ways to breakdown firms by specific characteristics (such as involvement in GVCs) which will make the sub-groups more homogeneous.
A GVC approach seems appropriate for the Handbook on a system of extended international and global accounts, since GVCs cut across geographic borders and bring together those global economic activities, goods and services, which belong together. Measurement of economic interdependencies (involving investment, job creation, income and intellectual property) within and across countries — between upstream design and downstream assembly — requires measurement of GVCs. Similarly, if we want to understand the interdependencies within and across countries for global retailers, financial and nonfinancial service providers, as well as horizontally-integrated enterprises, the GVC is the appropriate organizing framework.
This focus on GVCs has important implications for the unit of measurement and related data collection and estimation procedures. Most of the key decisions made by global manufacturers and global service providers are made at the enterprise rather than the establishment, or plant, level. This implies that for multi-national enterprises data on profits, research and development, transfer pricing, final product pricing, design, financing, advertising, and the rest of the links in GVCs are only available at the global enterprise level.
How to Integrate National SUIOTS into Global MCIO tables
Key Terms:
SUTs (Supply and Use Tables)
GVCs (Global Value Chains)
UN SEIGA (System of Extended International and Global Accounts)
UN SEEA (System of Environment Economic Accounts)
Bilateral Trade Matrix
TIVA ( Trade in Value Added)
MCIO (Multi Country Input Output Tables)
SUIOT ( Supply and Use Input Output Tables)
UN SNA (System of National Accounts)
UNSD ( United Nations Statistical Division)
UNECE ( United Nations Economic Commission for Europe)
EUROSTAT ( European Statistics Division)
IMF
UNCTAD (UN Conference on Trade and Development)
WTO ( World Trade Organization)
OECD
UN ITEGS (International Trade and Economic Globalization Statistics)
WIOD ( World Input Output Database)
FIGARO (Full International and Global Accounts for Research in
Input-Output Analysis)
Key Sources of Research:
Global Forum on Trade Statistics Measuring Global Trade — Do We Have the Right Numbers?
From Global Sustainability Accounting—Developing EXIOBASE for Multi-Regional Footprint Analysis
Perish or prosper? Human development must occur without overwhelming the natural ecosystems that we depend on. Sustainable development is now a constant focus of policy development, and sustainability metrics are becoming centralized within statistics. Models are continuously being developed to better inform policy processes while databases are being increasingly refined to provide the most complete and coherent description of society. To this end, focus has been applied on developing internationally applicable concepts within the United Nations framework for harmonizing economic and environmental accounting [1] so that we have global coverage and comparability between sustainability indicators. Significant progress has been made to harmonize the economic and environmental accounting principles with the System of Environmental-Economic Accounting (SEEA). We describe here the efforts made to operationalize a global-integrated accounting framework within the SEEA guidelines. The work focuses on the practicalities of implementing SEEA guidelines for data gathering, the amelioration of approaches for allocating supply chain impacts, and the demonstration of global impacts across the production and consumption perspectives.
There are two approaches in accounting for GHG emissions.
Production based Accounting
Consumption based Accounting
The relationship between production- and consumption-based emissions is ‘consumption- based emissions = production-based emissions – emissions embodied in exports + emissions embodied in imports’.
From Consumption-based emission accounting for Chinese cities
At present, few governments choose consumption-based accounting in determining their mitigation policies, and most global climate change agreements are based on production-based accounting, including the United Nations Framework Convention on Climate Change (UNFCCC) and the Kyoto Protocol. Consumption-based accounting’s advantages have been shown in many studies; this approach elucidates the drivers of emissions growth, improves cost-effectiveness and justice, addresses carbon leakage, promotes environmental comparative advantages, and encourages technology diffusion [13,22,26,40]. There are substantial differences between production- and consumption-based accounting in terms of calculating both overall and per capita carbon emissions levels. As a result, the selection of an emission accounting approach has a major influence on the allocation of responsibilities for climate change mitigation. The two different accounting approaches must thus be considered comprehensively to identify fair mitigation policies. At the city level, consumption- based accounting can help cities to reduce emissions both within city boundaries and along their entire supply chains at minimum cost. Interregional cooperation on climate change mitigation should employ consumption-based accounting to allocate mitigation responsibilities more fairly and efficiently. Therefore, consumption-based carbon emission accounting is a complementary tool for promoting climate action at the city level.
From Counting CO2 emissions in a globalised world
The main conclusions from this paper are:
Comprehensive carbon trade balances with embedded emissions show that emissions related to domestic consumption of products are significantly higher than those related to domestic production in many industrialised countries. The opposite is revealed for trade engaged developing and emerging economies.
Consumption-based carbon trade balances should be established in addition to productionbased balances because they can help in finding solutions to issues such as carbon leakage and emission targets for developing countries.
Background and methodology
2.1 Approaches to carbon accounting
The most commonly used method for CO2 accounting – production-based or territorial accounting – measures the CO2 emitted within a country. While it can be used to evaluate the global environmental impacts of the production and consumption activities of a specific country, it cannot identify shifts of environmental pressures as a result of changing global production, trade and consumption patterns. Moreover, it is not possible to use this approach to analyse carbon leakage or equity concerns related to the structure of trade relations between developing and industrialised countries (Schaeffer / Leal de Sá 1996).
By contrast, consumption-based emissions are calculated by adding the emissions arising from domestic production and emissions embodied in imports and subtracting the emissions embodied in exports (Nakano et al. 2009). Allocating emissions on a national production basis is easier than calculating them on a consumption basis because the latter requires the detailed specification of inter-industry and international trade structures. The calculation of emissions from the production of exports furthermore requires large quantities of country-specific, up- to-date data (in the form of so-called input-output tables and international trade data). Territo- rial accounting, by contrast, has clear system boundaries and good data availability.
The choice between the production and consumption accounting principle implies an inherent judgment on whether the producer or the consumer is responsible for the CO2 emissions.
2.2 Models for economy-wide carbon accounting
The most commonly used methodology to estimate embodied emissions in international trade and identify all direct and indirect effects of production is based on the analysis of input- output (IO) tables. Input-output tables express the structure of an economy in terms of the inputs to its various sectors and the nature of the outputs from those sectors. They can be used to investigate what an economy extracts from and introduces into the natural environment as well as the environmental implications of resource use of final consumption (Leontief / Ford 1970; Miller / Blair 1985; Walter 1973). Environmentally extended input-output analysis can be used to analyse the environmental effects of structural changes in the economy, such as technology, trade, investment and consumption.
There are two kinds of input-output-based approaches – Single-Region Input-Output (SRIO) models and Multi-Regional Input-Output (MRIO) models.4 As supply chains have become increasingly global over the past decades, MRIO models have gained in importance in meas- uring emissions embodied in trade. A multi-regional input-output model includes all trade linkages between regions and shows how many domestic and imported products are required from each sector in each region. The main advantages of the MRIO approach are:
MRIO models enable an accurate and comprehensive evaluation of the environmental impacts embedded in trade because they link (monetary) trade flows and environmental databases, taking variations in production structures and technologies between different countries and world regions into account (Wiedmann et al. 2007a).
MRIO models can be used to conduct different analyses at the international level, such as structural path analysis, production layer composition, quantification of shared environ- mental responsibilities between producers and consumers of goods (Wiedmann et al. 2007a; Wiedmann et al. 2007b).
MRIO models can help to capture direct, indirect and induced effects of international trade (Wiedmann et al. 2007a).
In recent years, complex multi-regional multi-sectoral input-output models have been used to identify the environmental pressures that occur along the international supply chains of products (Ahmad / Wyckoff 2003; Peters / Hertwich 2004).5 The latest studies to calculate embodied CO2 emissions which distinguish a large number of countries and regions, based on the Global Trade Analysis Project (GTAP) database, include Peters and Hertwich (2008b) and Minx et al. (2008).
Global MRIO
WIOD
EORA
EXIOBASE
GTAP/OPENEU
IDE-JETRO
GRAM
OECD
From GLOBAL MULTIREGIONAL INPUT–OUTPUT FRAMEWORKS: AN INTRODUCTION AND OUTLOOK
What Accounts for the Growth of Carbon Dioxide Emissions in Advanced and Emerging Economies? The Role of Consumption, Technology, and Global Supply Chain Trade
Understanding Global Value Chains – G20/OECD/WB Initiative
There is lot of opacity in understanding of GVCs. Efforts are underway since last few years to get better analytical and statistical tools to understand International Trade and Global Value Chains.
Globalization in Trade and Finance encouraged by International organizations such as IMF/WB/OECD/WTO/UNCTAD/UNIDO and others has changed the landscape of Trade.
There is still a long way to go to make better sense of issues and concerns for policy makers.
OECD/WB/WTO along with G20 Trade Ministers have initiated efforts since 2012.
From Global Value Chains
Introduction to GVCs
International production, trade and investments are increasingly organised within so-called global value chains (GVCs) where the different stages of the production process are located across different countries. Globalisation motivates companies to restructure their operations internationally through outsourcing and offshoring of activities.
Firms try to optimise their production processes by locating the various stages across different sites. The past decades have witnessed a strong trend towards the international dispersion of value chain activities such as design, production, marketing, distribution, etc.
This emergence of GVCs challenges conventional wisdom on how we look at economic globalisation and in particular, the policies that we develop around it.
Trade in Value Added
The goods and services we buy are composed of inputs from various countries around the world. However, the flows of goods and services within these global production chains are not always reflected in conventional measures of international trade. The joint OECD – WTO Trade in Value-Added (TiVA) initiative addresses this issue by considering the value added by each country in the production of goods and services that are consumed worldwide. TiVA indicators are designed to better inform policy makers by providing new insights into the commercial relations between nations.
GVCs and Trade Policy
Global value chains (GVCs) have become a dominant feature of world trade, encompassing developing, emerging, and developed economies. The whole process of producing goods, from raw materials to finished products, is increasingly carried out wherever the necessary skills and materials are available at competitive cost and quality. Similarly, trade in services is essential for the efficient functioning of GVCs, not only because services link activities across countries but also because they help companies to increase the value of their products. This fragmentation highlights the importance of an ambitious complementary policy agenda to leverage engagement in GVCs into more inclusive growth and employment and the OECD is currently undertaking comprehensive statistical and analytical work that aims to shed light on the scale, nature and consequences of international production sharing.
From Global Value Chains/Global Production Networks: Organizing the Global Economy
The key organizational feature of the global economy?
“Global Value Chains are defined by fragmented supply chains, with internationally dispersed tasks and activities coordinated by a lead firm (a TNC)” (UNCTAD, 2013, p.125; original italics).
Data gathering exercises:UNCTAD,OECD,WTO,JETRO…
Now firmly on the agenda among leading international economic organizations
The international division of labour:imperial/colonialsystems and exchanges of raw materials and finished goods
The new international division of labour(NIDL):establishment of overseas production bases of core country TNCs
The global division of labour:much more complex global networks lying behind the production of different goods and services
The phenomenon
About 60% of global trade, which today amounts to more than $20 trillion, consists of trade in intermediate goods and services that are incorporated at various stages in the production process of goods and services for final consumption” (UNCTAD, 2013, p. 122)
Not new, but since 2000 trade and FDI have increased exponentially, and ahead of GDP growth, highlighting a growth in TNC coordinated global value chains
Double counting – approx. 25-30% of value of world trade, e.g. the iPhone example. Not just trade from China to US, but incorporates high value components from Japan, South Korea etc.
Beyond national economies and basic trade data, and beyond TNCs and FDI, to more complex organizational structures involving intra-firm trade, arm’s length trade and non-equity modes e.g. subcontracting
From GLOBAL VALUE CHAIN ANALYSIS: A PRIMER
From Global Capitalism and Commodity Chains: Looking Back, Going Forward
From Global Value Chains/Global Production Networks: Organizing the Global Economy
Key Terms
Global Commodities Chains (GCCs)
Global Production Networks (GPNs)
Global Value Chains (GVCs)
Strategic Coupling
Economic Deepening
Trans National Corporation (TNC)
Multi National Corporation (MNC)
Multi National Enterprises (MNE)
SMILE curve
Economic Clusters
UNIDO (United Nations Industrial Development Organization)
OECD (Organization for Economic Cooperation and Development)
WTO (World Trade Organization)
WB (World Bank)
UNESCAP (Economic and Social Commission for Asia and Pacific)
UNCTAD ( United Nations Commission for Trade and Development)
ILO ( International Labor Organization)
G20 ( Group of 20 Nations)
TIVA ( Trade in Value Added)
On shoring
Off shoring
Outsourcing
Key People
Gary Gereffi
Neil M Coe
Jennifer Bair
Henry Wai-chung Yeung
Timothy Sturgeon
Key Sources of Research:
Measuring Trade in Value Added: An OECD-WTO joint initiative